OPEN-SOURCE SCRIPT
已更新 Market Structure (Nephew_Sam_)
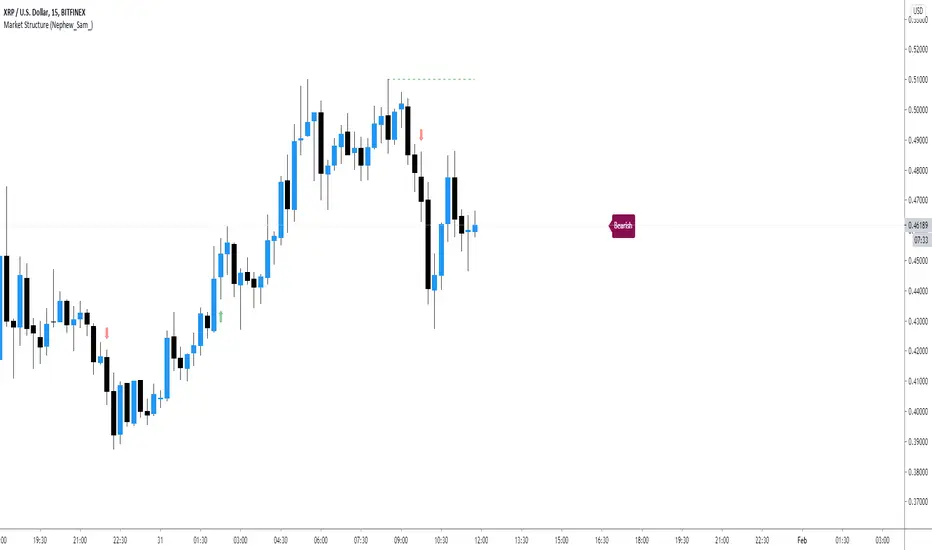
This indicator consists of 3 features:
1. Plots label to the right for current market structure
2. Plots dashed line to show where the next market structure would be
3. Draws arrows above/below historical market structure breaks
This might get a little to noisy in ranging markets or lower timeframes but it does the job.
Credits to SimpleCryptoLife for the source code.
This script is take from the indicator "True Market Structure" which is created by the above mentioned user
Copyright rules for reusing the script:
// == COPYRIGHT ==
// Script by @SimpleCrpytoLife. This script is open-source.
// --> If you use ideas from it, you don't need to ask or give credit to me.
// --> If you copy code out of here to adapt for your own script, it must be open-source. You don't need to ask permission, just credit @SimpleCryptoLife.
發行說明
Added multiple timeframes label發行說明
Reverted new update, too many bugs.開源腳本
本著TradingView的真正精神,此腳本的創建者將其開源,以便交易者可以查看和驗證其功能。向作者致敬!雖然您可以免費使用它,但請記住,重新發佈程式碼必須遵守我們的網站規則。
免責聲明
這些資訊和出版物並不意味著也不構成TradingView提供或認可的金融、投資、交易或其他類型的意見或建議。請在使用條款閱讀更多資訊。
開源腳本
本著TradingView的真正精神,此腳本的創建者將其開源,以便交易者可以查看和驗證其功能。向作者致敬!雖然您可以免費使用它,但請記住,重新發佈程式碼必須遵守我們的網站規則。
免責聲明
這些資訊和出版物並不意味著也不構成TradingView提供或認可的金融、投資、交易或其他類型的意見或建議。請在使用條款閱讀更多資訊。