INVITE-ONLY SCRIPT
已更新 ™TradeChartist Intensity
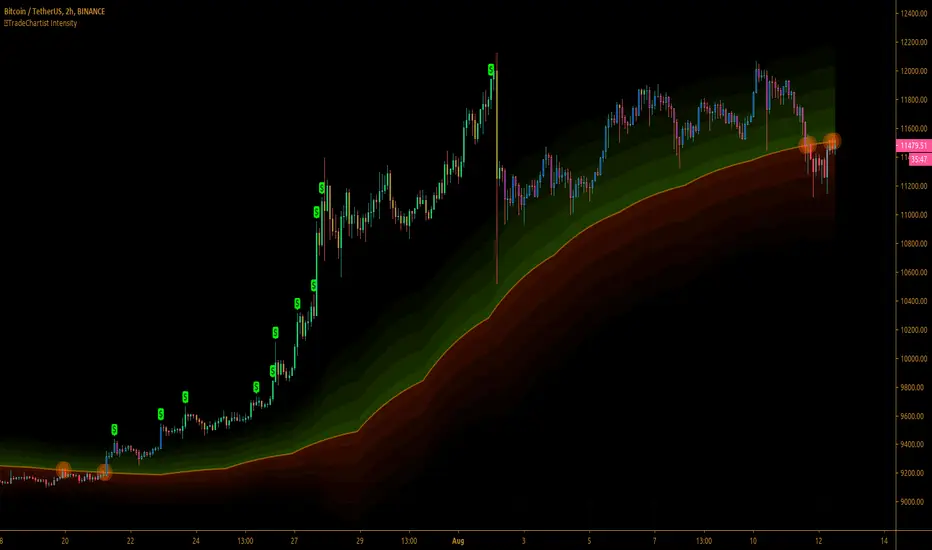
™TradeChartist Intensity is a visual indicator that comes with Intensity color candles and Auto-fibs feature that helps any trader with Entry/Exit and levels confirmation based on where the price is, in relation to the Orange Price Equilibrium line and the 5 zones of Bull/Bear limits that fade into the top or bottom outer space.
™TradeChartist Intensity itself doesn't plot BUY or SELL signals, but when used with ™TradeChartist Rubicon gives a better picture for trade confirmations. It can also be used as a standalone indicator and works equally effective with other traditional and non-traditional indicators.
The indicator comes with simple settings with useful features outlined below.
Intensity Color Candles
Intensity Color Candles when activated from settings paints the candles/bars with colors specific to the Bull/Bear limits or the outer space and is easy to identify the signal strength over time.
When the price candle wick or body touches the Orange Price Equilibrium line, distinct torchlight circle appears to signal the trader of a potential change in price direction which can be used as a signal confirmation in conjunction with another indicator before taking a trade position.
Show Auto Fib Levels
Auto Fib Levels plot automatic Fib levels based on significant Highs and Lows based on Intensity strategy which mostly are reference prices of recent highest high above Orange Equilibrium price line and recent lowest low below the Orange Equilibrium price line.
15m XBT chart with 'Show Auto Fib Levels' checked and 'Show Fibs from current High/Low' unchecked under indicator settings

These Auto Fib Levels change when the price movement/trend changes direction and will be based on trending price direction.
Show Fibs from current High/Low
When this option is chosen from indicator settings, the auto fib levels are drawn from the highest high of the trending price direction to lowest low of last trend for uptrend or vice-versa for downtrend.
15m XBT chart as above with 'Show Fibs from current High/Low' unchecked under indicator settings

Show Profit Candles
Activating this option from indicator settings will automatically plot $ labels above candle highs that hit important resistance levels during uptrend and candle lows that hit important support levels during downtrend. This will help traders take out profits during trades based on their personal profit goals and realistic trade targets based on momentum/RSI/volatility etc.
Example chart of XAUUSD 1hr Gold chart showing both Long and Short trade Profit candles

Give a thumbs up or leave a comment if you like the script.
™TradeChartist Intensity itself doesn't plot BUY or SELL signals, but when used with ™TradeChartist Rubicon gives a better picture for trade confirmations. It can also be used as a standalone indicator and works equally effective with other traditional and non-traditional indicators.
The indicator comes with simple settings with useful features outlined below.
Intensity Color Candles
Intensity Color Candles when activated from settings paints the candles/bars with colors specific to the Bull/Bear limits or the outer space and is easy to identify the signal strength over time.
- Uptrend - The bars/candles move away from the Orange Price Equilibrium line towards the upper Bull limits with bar color fading slowly leading to outer space where the bar color turns neon green.
- Downtrend - The bars/candles move away from the Orange Price Equilibrium line towards the lower Bear limits with bar color fading slowly leading to outer space where the bar color turns neon red.
When the price candle wick or body touches the Orange Price Equilibrium line, distinct torchlight circle appears to signal the trader of a potential change in price direction which can be used as a signal confirmation in conjunction with another indicator before taking a trade position.
Show Auto Fib Levels
Auto Fib Levels plot automatic Fib levels based on significant Highs and Lows based on Intensity strategy which mostly are reference prices of recent highest high above Orange Equilibrium price line and recent lowest low below the Orange Equilibrium price line.
15m XBT chart with 'Show Auto Fib Levels' checked and 'Show Fibs from current High/Low' unchecked under indicator settings
These Auto Fib Levels change when the price movement/trend changes direction and will be based on trending price direction.
Show Fibs from current High/Low
When this option is chosen from indicator settings, the auto fib levels are drawn from the highest high of the trending price direction to lowest low of last trend for uptrend or vice-versa for downtrend.
15m XBT chart as above with 'Show Fibs from current High/Low' unchecked under indicator settings
Show Profit Candles
Activating this option from indicator settings will automatically plot $ labels above candle highs that hit important resistance levels during uptrend and candle lows that hit important support levels during downtrend. This will help traders take out profits during trades based on their personal profit goals and realistic trade targets based on momentum/RSI/volatility etc.
Example chart of XAUUSD 1hr Gold chart showing both Long and Short trade Profit candles
Give a thumbs up or leave a comment if you like the script.
發行說明
Updated - Logic to calculate levels quickerAdded - Option to hide/unhide Intensity Bands
Added - Highs/Lows plot for updated Auto-Fibs calculation
發行說明
Code Updated.Removed AutoFibs as it is computation heavy and creates Memory usage limit error.
僅限邀請腳本
僅作者批准的使用者才能訪問此腳本。您需要申請並獲得使用許可,通常需在付款後才能取得。更多詳情,請依照作者以下的指示操作,或直接聯絡TradeChartist。
TradingView不建議在未完全信任作者並了解其運作方式的情況下購買或使用腳本。您也可以在我們的社群腳本中找到免費的開源替代方案。
作者的說明
Get in touch with me if you would like access to my Premium scripts for a trial before deciding on lifetime access.
Telegram - @Trade_Chartist
Free Scripts - bit.ly/Free-Scripts
Telegram - @Trade_Chartist
Free Scripts - bit.ly/Free-Scripts
免責聲明
這些資訊和出版物並非旨在提供,也不構成TradingView提供或認可的任何形式的財務、投資、交易或其他類型的建議或推薦。請閱讀使用條款以了解更多資訊。