OPEN-SOURCE SCRIPT
Investor Tool - Z Score
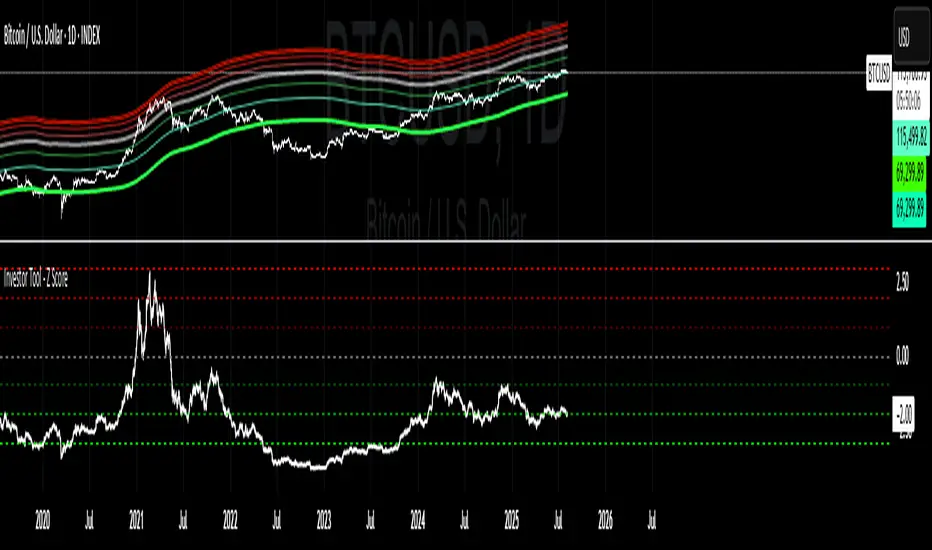
The Investor Tool is intended as a tool for long term investors, indicating periods where prices are likely approaching cyclical tops or bottoms. The tool uses two simple moving averages of price as the basis for under/overvalued conditions: the 2-year MA (green) and a 5x multiple of the 2-year MA (red).
Price trading below the 2-year MA has historically generated outsized returns, and signalled bear cycle lows.
Price trading above the 2-year MA x5 has been historically signalled bull cycle tops and a zone where investors de-risk.
Just like the Glassnode one, but here on TV and with StDev bands
Now with Z-SCORE calculation:
The Z-Score is calculated to be -3 Z at the bottom bands and 3 Z at the top bands
Pine Script®
Created for TRW
Price trading below the 2-year MA has historically generated outsized returns, and signalled bear cycle lows.
Price trading above the 2-year MA x5 has been historically signalled bull cycle tops and a zone where investors de-risk.
Just like the Glassnode one, but here on TV and with StDev bands
Now with Z-SCORE calculation:
The Z-Score is calculated to be -3 Z at the bottom bands and 3 Z at the top bands
mean = (upper_sma + bottom_sma) / 2
bands_range = upper_sma - bottom_sma
stdDev = bands_range != 0 ? bands_range / 6 : 0
zScore = stdDev != 0 ? (close - mean) / stdDev : 0
Created for TRW
開源腳本
秉持TradingView一貫精神,這個腳本的創作者將其設為開源,以便交易者檢視並驗證其功能。向作者致敬!您可以免費使用此腳本,但請注意,重新發佈代碼需遵守我們的社群規範。
免責聲明
這些資訊和出版物並非旨在提供,也不構成TradingView提供或認可的任何形式的財務、投資、交易或其他類型的建議或推薦。請閱讀使用條款以了解更多資訊。
開源腳本
秉持TradingView一貫精神,這個腳本的創作者將其設為開源,以便交易者檢視並驗證其功能。向作者致敬!您可以免費使用此腳本,但請注意,重新發佈代碼需遵守我們的社群規範。
免責聲明
這些資訊和出版物並非旨在提供,也不構成TradingView提供或認可的任何形式的財務、投資、交易或其他類型的建議或推薦。請閱讀使用條款以了解更多資訊。