OPEN-SOURCE SCRIPT
已更新 Squeeze Momentum Indicator [LazyBear] vX by DGT
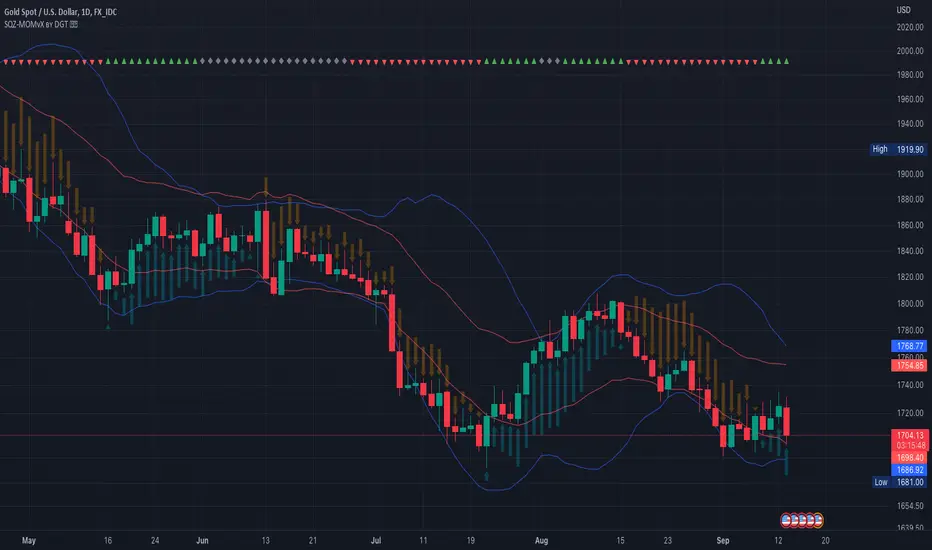
Modified version of Squeeze Momentum Indicator [LazyBear] visualizing on Price Chart
author: LazyBear, modified by KıvançÖZBİLGİÇ
author: LazyBear, modified by KıvançÖZBİLGİÇ
發行說明
small update: Keltner Channel calculations replaced by kc(series, length, mult, useTrueRange) build-in function 發行說明
enhancementThe Squeeze Indicator measures the relationship between Bollinger Bands and Keltner's Channels to help identify consolidations and signal when prices are likely to break out (whether up or down).
The Squeeze Indicator finds sections of the Bollinger Bands which fall inside the Keltner's Channels and in this case the market is said to be in a squeeze (indicator turns off, displayed with grey diamond shapes in this study)
When the volatility increases, so does the distance between the bands, conversely, when the volatility declines, the distance also decreases and in such cases the squeeze is said to be released (indicator turns on, displayed with triangle up or triangle down shapes)
To produce Buy/Sell signals, the Squeeze indicator is plotted along with Momentum Oscillator
When the indicator is on and the Momentum Oscillator Histogram is green, it is considered a Buy signal (this signal is supposed to be correct until two green bars in a row).
When the indicator is on and the Momentum Oscillator Histogram is red, it is considered a Sell signal (this signal is supposed to be correct until two red bars in a row).
When the market finishes a move, the indicator turns off (grey) and no trade is recommended
發行說明
Update- Multi TimeFrame ability added
- The Squeeze Indicator measures the relationship between Bollinger Bands and Keltner's Channels, hence made them optionally visable
- Removed Label
發行說明
Update * Squeeze Release Alert Addition
* Pine Script v5 Update
開源腳本
本著TradingView的真正精神,此腳本的創建者將其開源,以便交易者可以查看和驗證其功能。向作者致敬!雖然您可以免費使用它,但請記住,重新發佈程式碼必須遵守我們的網站規則。
Our Premium Indicators: sites.google.com/view/solemare-analytics
免責聲明
這些資訊和出版物並不意味著也不構成TradingView提供或認可的金融、投資、交易或其他類型的意見或建議。請在使用條款閱讀更多資訊。
開源腳本
本著TradingView的真正精神,此腳本的創建者將其開源,以便交易者可以查看和驗證其功能。向作者致敬!雖然您可以免費使用它,但請記住,重新發佈程式碼必須遵守我們的網站規則。
Our Premium Indicators: sites.google.com/view/solemare-analytics
免責聲明
這些資訊和出版物並不意味著也不構成TradingView提供或認可的金融、投資、交易或其他類型的意見或建議。請在使用條款閱讀更多資訊。