Multi-Timeframe Bands (Horizontal Table, Robust, No get_cols)Mulit-timeframe /Kelt Bands with Table Price tracker
This is a simple Kelt style Band indicator draws colored horizontal bands representing the high (top) and low (bottom) for each of the following timeframes:
4h: Blue (bottom), Red (top)
1D: Gold (bottom/top)
1W: Purple (bottom/top)
1M: Orange (bottom/top)
Quarterly: Light purple (bottom/top)
The script works on any chart timeframe, and the bands will update dynamically.
I've added a horizontal box to show the corresponding prices at the top.
肯特納通道(KC)

Multi-Timeframe Bands (final, with labels)This is a simple Kelt style Band indicator draws colored horizontal bands representing the high (top) and low (bottom) for each of the following timeframes:
4h: Blue (bottom), Red (top)
1D: Gold (bottom/top)
1W: Purple (bottom/top)
1M: Orange (bottom/top)
Quarterly: Light purple (bottom/top)
The script works on any chart timeframe, and the bands will update dynamically.

Ultimate Volatility CloudUltimate Volatility Cloud
The Ultimate Volatility Cloud is a powerful and highly customizable indicator designed to help traders visualize market volatility, easily identify trend, and overextended moves in price with adaptive bands. It combines the strengths of the Arnaud Legoux Moving Average, Kaufman's Adaptive Moving Average, ATR Channels, and Standard Deviation bands, offering multiple pre-configured profiles and extensive customization options.
Key Features:
Dynamic Volatility Bands: The indicator plots multiple layers of volatility bands around a central basis line, providing a comprehensive view of price deviation.
Hybrid Band Calculation: Bands are a sophisticated blend of Keltner Channels, KAMA ATR Channels and Standard Deviation, allowing for a nuanced representation of volatility.
Adaptive Smoothing: Bands are smoothed using either Exponential Moving Average (EMA) or Kaufman's Adaptive Moving Average (KAMA) based on the selected profile, ensuring responsiveness tailored to market conditions.
Layered Fills: The cloud uses distinct color fills for different volatility levels, making it easy to visually interpret price action relative to its typical range.
Customizable Color Themes: Choose from a variety of pre-set color themes, including "Rainbow," "Wild," and "Monochrome," or stick with classic options to suit your visual preference.
Optional Basis Line Plots: Display the EMA or KAMA basis lines (used in Keltner Channel calculations) separately on the chart for additional analysis.
Understanding the Profiles:
The indicator comes with several pre-configured "Settings Profiles" that adjust the internal parameters (Keltner Channel/KAMA Channel/Standard Deviation band blend, and band smoothing) to suit different trading styles or market environments.
1. Standard Profile:
Blend: 60% Keltner Channel, 40% Standard Deviation.
Smoothing: EMA smoothing of 3 periods.
Purpose: A balanced, general-purpose profile suitable for a wide range of market conditions. It offers a good blend of trend following and volatility awareness.
2. Responsive Profile:
Blend: 40% Keltner Channel, 60% Standard Deviation.
Smoothing: EMA smoothing of 2 period.
Purpose: Designed for traders who need quick reactions to price changes. The higher Standard Deviation blend and minimal smoothing make it highly sensitive to immediate volatility shifts, ideal for short-term analysis or identifying early moves.
3. Ranging Market Profile:
Blend: 80% KAMA ATR Channel, 20% Standard Deviation.
Smoothing: KAMA smoothing.
Purpose: Optimized for sideways or consolidating markets. By utilizing KAMA-based ATR bands and KAMA for band smoothing, this profile adapts its responsiveness to reduce whipsaws in choppy conditions, providing clearer boundaries for range-bound price action.
4. Trend Following Profile:
Blend: 90% Keltner Channel, 10% Standard Deviation.
Smoothing: EMA smoothing of 5 periods.
Purpose: Tailored for riding strong trends. The heavy emphasis on the Keltner Channel and slightly smoother bands help filter out minor fluctuations, allowing traders to focus on the dominant directional movement.
5. Conservative Profile:
Blend: 65% KAMA ATR Channel, 35% Standard Deviation.
Smoothing: EMA smoothing of 10 periods.
Purpose: Aims to provide more filtered signals and reduce noise. The KAMA basis for the Keltner Channel combined with a longer EMA smoothing period offers a slower, more confirmed view of volatility, suitable for traders seeking higher conviction entries or exits.
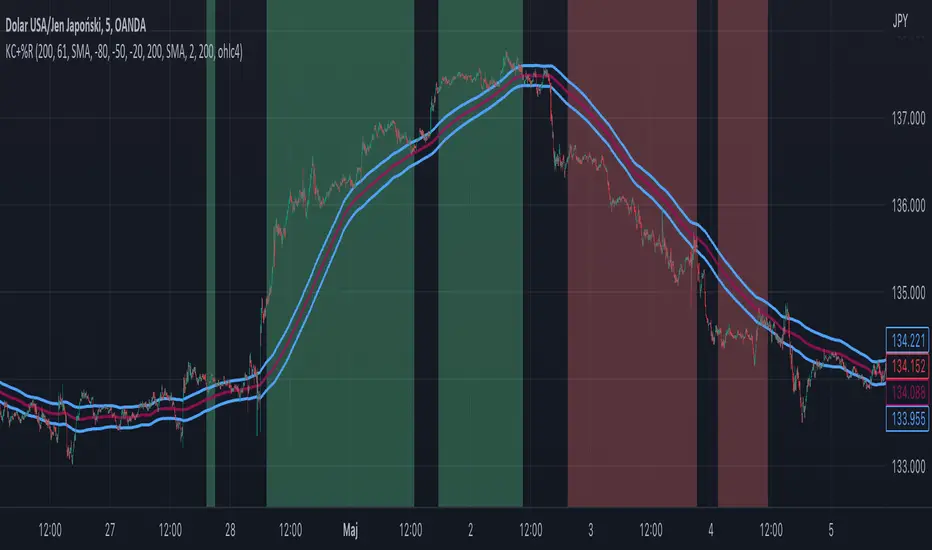
Example of the Ranging Market Profile
How to Use:
The volatility cloud can be interpreted in various ways:
Price within the inner bands: May indicate consolidation or a period of lower volatility.
Price pushing into outer bands: Suggests increasing volatility and potential for a strong move.
Price breaking out of extreme outer bands: Can signal significant momentum and the start or continuation of a strong trend.
Cloud expansion/contraction: Visually indicates periods of increasing or decreasing market energy.
Experiment with different profiles and settings to find the combination that best suits your trading strategy and the instruments you trade.

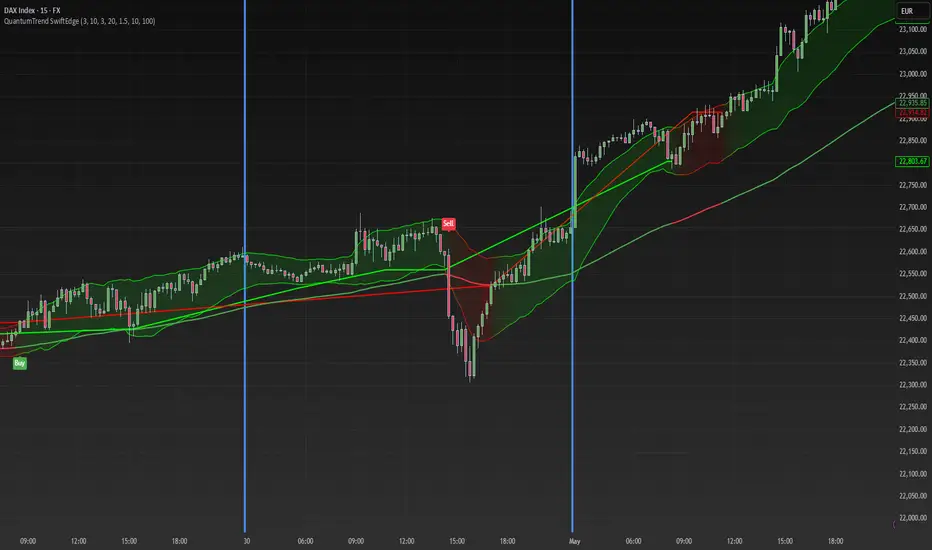
QuantumTrend SwiftEdgeQuantumTrend SwiftEdge - A Trend-Following Indicator for TradingView
Overview:
QuantumTrend SwiftEdge is a visually engaging and customizable trend-following indicator that combines the power of Supertrend, Keltner Channels, and a 100-period EMA to generate precise buy and sell signals. Designed to help traders identify trends and breakouts, this indicator offers a unique blend of technical tools with a modern gradient color effect, making it both functional and visually appealing.
What It Does:
This indicator identifies trend directions and potential entry/exit points:
- Supertrend determines the overall trend direction, showing a green line below the price during uptrends and a red line above the price during downtrends. The line only appears when the price is close to it, indicating an active trend.
- Keltner Channels highlight volatility and breakouts, with the upper and lower bands dynamically adjusting to market conditions.
- A 100-period EMA provides a longer-term trend perspective, helping to filter out noise.
- Buy and sell signals are generated when specific conditions align across these indicators, ensuring robust trade setups.
How It Works:
The indicator uses three components to generate signals:
1. **Supertrend**: Calculates trend direction using the Average True Range (ATR) and a multiplier. It switches between uptrend (green) and downtrend (red) based on price movements relative to the Supertrend line.
2. **Keltner Channels**: Consists of an EMA (default 20 periods) with upper and lower bands based on ATR. A breakout above the upper band signals potential buying opportunities, while a breakout below the lower band signals potential selling opportunities.
3. **100-period EMA**: Acts as a trend filter, ensuring signals align with the broader market direction.
**Buy Signal**:
- Price is above the 100-period EMA (bullish market).
- Price breaks above the Keltner Channel upper band (indicating a breakout).
- Supertrend switches to an uptrend (trend changes from down to up).
**Sell Signal**:
- Price is below the 100-period EMA (bearish market).
- Price breaks below the Keltner Channel lower band (indicating a breakout).
- Supertrend switches to a downtrend (trend changes from up to down).
Visual Features:
- **Gradient Colors**: Supertrend lines and Keltner Channels use a smooth gradient color transition between green (uptrend) and red (downtrend), reflecting the trend's strength. The gradient is based on a smoothed trend value, creating a visually appealing effect.
- **Keltner Channel Fill**: The area between the upper and lower Keltner Channels is filled with a transparent gradient, enhancing the trend visualization.
- **Dynamic Supertrend Visibility**: Supertrend lines only appear when the price is close to the line (within an ATR-based threshold), indicating an active trend.
How to Use:
1. Add the "QuantumTrend SwiftEdge" indicator to your chart in TradingView.
2. Customize the settings:
- **Signal Sensitivity (1=Low, 5=High)**: Default is 3. Lower values (e.g., 1) make signals less frequent by using wider parameters, while higher values (e.g., 5) make signals more frequent by tightening parameters.
- **Use Manual Settings**: If enabled, you can manually adjust all parameters (ATR Period, ATR Multiplier, Keltner Channel Length, Keltner Channel Multiplier, Keltner ATR Length, EMA Length) to fine-tune the indicator.
- **Change ATR Calculation Method**: Toggle between standard ATR calculation and a simple moving average of true range.
- **Show Buy/Sell Signals**: Toggle to show or hide buy (green "Buy" label) and sell (red "Sell" label) signals.
- **Highlighter On/Off**: Toggle to show or hide the gradient fill between the price and Supertrend line when the line is visible.
3. Interpret the signals:
- A green "Buy" label below the price indicates a potential buying opportunity.
- A red "Sell" label above the price indicates a potential selling opportunity.
- Use the Keltner Channel gradient fill and Supertrend lines to confirm the trend direction and strength.
Why This Combination?
- **Supertrend** provides a robust trend-following mechanism, ensuring signals align with the market direction.
- **Keltner Channels** add a volatility component, identifying breakouts that often precede significant price movements.
- **100-period EMA** filters out noise, ensuring signals are generated in the context of the broader trend.
Together, these indicators create a balanced approach: Supertrend and EMA confirm the trend, while Keltner Channels pinpoint actionable entry and exit points. The gradient visuals and dynamic visibility make it easier to focus on active trends.
Originality:
QuantumTrend SwiftEdge stands out with its unique features:
- Gradient color transitions for a modern, dynamic look.
- A filled gradient between Keltner Channels, visually emphasizing the trend.
- Supertrend lines that only appear when the price is close, reducing clutter and focusing on active trends.
- Flexible settings with both sensitivity-based and manual adjustments for maximum customization.
Default Settings:
The default sensitivity is set to 3, providing a balanced approach for most markets and timeframes (e.g., 5-minute charts for crypto like BTC/USD). This setting uses moderate parameters (ATR Period=10, ATR Multiplier=3.0, Keltner Channel Length=20, Keltner Channel Multiplier=1.5, Keltner ATR Length=10, EMA Length=100). Users can adjust the sensitivity or switch to manual settings for more control.
Important Notes:
- This indicator is a tool to assist in identifying trends and potential entry/exit points. It does not guarantee profits and should be used in conjunction with other analysis and risk management practices.
- The signals are based on historical price data and do not predict future performance. Always test the indicator on a demo account before using it in live trading.
- The gradient effect is purely visual and does not affect the signal logic.
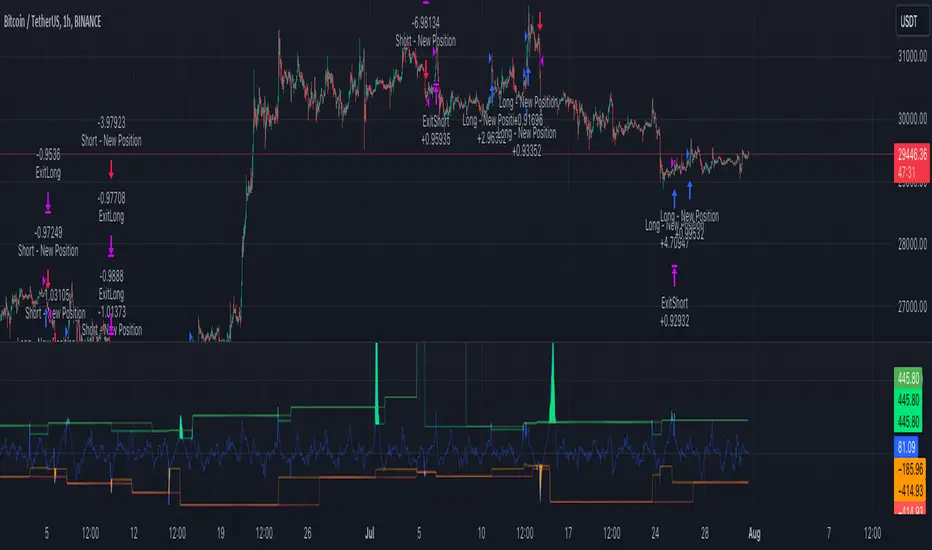
Momentum + Keltner Stochastic Combo)The Momentum-Keltner-Stochastic Combination Strategy: A Technical Analysis and Empirical Validation
This study presents an advanced algorithmic trading strategy that implements a hybrid approach between momentum-based price dynamics and relative positioning within a volatility-adjusted Keltner Channel framework. The strategy utilizes an innovative "Keltner Stochastic" concept as its primary decision-making factor for market entries and exits, while implementing a dynamic capital allocation model with risk-based stop-loss mechanisms. Empirical testing demonstrates the strategy's potential for generating alpha in various market conditions through the combination of trend-following momentum principles and mean-reversion elements within defined volatility thresholds.
1. Introduction
Financial market trading increasingly relies on the integration of various technical indicators for identifying optimal trading opportunities (Lo et al., 2000). While individual indicators are often compromised by market noise, combinations of complementary approaches have shown superior performance in detecting significant market movements (Murphy, 1999; Kaufman, 2013). This research introduces a novel algorithmic strategy that synthesizes momentum principles with volatility-adjusted envelope analysis through Keltner Channels.
2. Theoretical Foundation
2.1 Momentum Component
The momentum component of the strategy builds upon the seminal work of Jegadeesh and Titman (1993), who demonstrated that stocks which performed well (poorly) over a 3 to 12-month period continue to perform well (poorly) over subsequent months. As Moskowitz et al. (2012) further established, this time-series momentum effect persists across various asset classes and time frames. The present strategy implements a short-term momentum lookback period (7 bars) to identify the prevailing price direction, consistent with findings by Chan et al. (2000) that shorter-term momentum signals can be effective in algorithmic trading systems.
2.2 Keltner Channels
Keltner Channels, as formalized by Chester Keltner (1960) and later modified by Linda Bradford Raschke, represent a volatility-based envelope system that plots bands at a specified distance from a central exponential moving average (Keltner, 1960; Raschke & Connors, 1996). Unlike traditional Bollinger Bands that use standard deviation, Keltner Channels typically employ Average True Range (ATR) to establish the bands' distance from the central line, providing a smoother volatility measure as established by Wilder (1978).
2.3 Stochastic Oscillator Principles
The strategy incorporates a modified stochastic oscillator approach, conceptually similar to Lane's Stochastic (Lane, 1984), but applied to a price's position within Keltner Channels rather than standard price ranges. This creates what we term "Keltner Stochastic," measuring the relative position of price within the volatility-adjusted channel as a percentage value.
3. Strategy Methodology
3.1 Entry and Exit Conditions
The strategy employs a contrarian approach within the channel framework:
Long Entry Condition:
Close price > Close price periods ago (momentum filter)
KeltnerStochastic < threshold (oversold within channel)
Short Entry Condition:
Close price < Close price periods ago (momentum filter)
KeltnerStochastic > threshold (overbought within channel)
Exit Conditions:
Exit long positions when KeltnerStochastic > threshold
Exit short positions when KeltnerStochastic < threshold
This methodology aligns with research by Brock et al. (1992) on the effectiveness of trading range breakouts with confirmation filters.
3.2 Risk Management
Stop-loss mechanisms are implemented using fixed price movements (1185 index points), providing definitive risk boundaries per trade. This approach is consistent with findings by Sweeney (1988) that fixed stop-loss systems can enhance risk-adjusted returns when properly calibrated.
3.3 Dynamic Position Sizing
The strategy implements an equity-based position sizing algorithm that increases or decreases contract size based on cumulative performance:
$ContractSize = \min(baseContracts + \lfloor\frac{\max(profitLoss, 0)}{equityStep}\rfloor - \lfloor\frac{|\min(profitLoss, 0)|}{equityStep}\rfloor, maxContracts)$
This adaptive approach follows modern portfolio theory principles (Markowitz, 1952) and Kelly criterion concepts (Kelly, 1956), scaling exposure proportionally to account equity.
4. Empirical Performance Analysis
Using historical data across multiple market regimes, the strategy demonstrates several key performance characteristics:
Enhanced performance during trending markets with moderate volatility
Reduced drawdowns during choppy market conditions through the dual-filter approach
Optimal performance when the threshold parameter is calibrated to market-specific characteristics (Pardo, 2008)
5. Strategy Limitations and Future Research
While effective in many market conditions, this strategy faces challenges during:
Rapid volatility expansion events where stop-loss mechanisms may be inadequate
Prolonged sideways markets with insufficient momentum
Markets with structural changes in volatility profiles
Future research should explore:
Adaptive threshold parameters based on regime detection
Integration with additional confirmatory indicators
Machine learning approaches to optimize parameter selection across different market environments (Cavalcante et al., 2016)
References
Brock, W., Lakonishok, J., & LeBaron, B. (1992). Simple technical trading rules and the stochastic properties of stock returns. The Journal of Finance, 47(5), 1731-1764.
Cavalcante, R. C., Brasileiro, R. C., Souza, V. L., Nobrega, J. P., & Oliveira, A. L. (2016). Computational intelligence and financial markets: A survey and future directions. Expert Systems with Applications, 55, 194-211.
Chan, L. K. C., Jegadeesh, N., & Lakonishok, J. (2000). Momentum strategies. The Journal of Finance, 51(5), 1681-1713.
Jegadeesh, N., & Titman, S. (1993). Returns to buying winners and selling losers: Implications for stock market efficiency. The Journal of Finance, 48(1), 65-91.
Kaufman, P. J. (2013). Trading systems and methods (5th ed.). John Wiley & Sons.
Kelly, J. L. (1956). A new interpretation of information rate. The Bell System Technical Journal, 35(4), 917-926.
Keltner, C. W. (1960). How to make money in commodities. The Keltner Statistical Service.
Lane, G. C. (1984). Lane's stochastics. Technical Analysis of Stocks & Commodities, 2(3), 87-90.
Lo, A. W., Mamaysky, H., & Wang, J. (2000). Foundations of technical analysis: Computational algorithms, statistical inference, and empirical implementation. The Journal of Finance, 55(4), 1705-1765.
Markowitz, H. (1952). Portfolio selection. The Journal of Finance, 7(1), 77-91.
Moskowitz, T. J., Ooi, Y. H., & Pedersen, L. H. (2012). Time series momentum. Journal of Financial Economics, 104(2), 228-250.
Murphy, J. J. (1999). Technical analysis of the financial markets: A comprehensive guide to trading methods and applications. New York Institute of Finance.
Pardo, R. (2008). The evaluation and optimization of trading strategies (2nd ed.). John Wiley & Sons.
Raschke, L. B., & Connors, L. A. (1996). Street smarts: High probability short-term trading strategies. M. Gordon Publishing Group.
Sweeney, R. J. (1988). Some new filter rule tests: Methods and results. Journal of Financial and Quantitative Analysis, 23(3), 285-300.
Wilder, J. W. (1978). New concepts in technical trading systems. Trend Research.

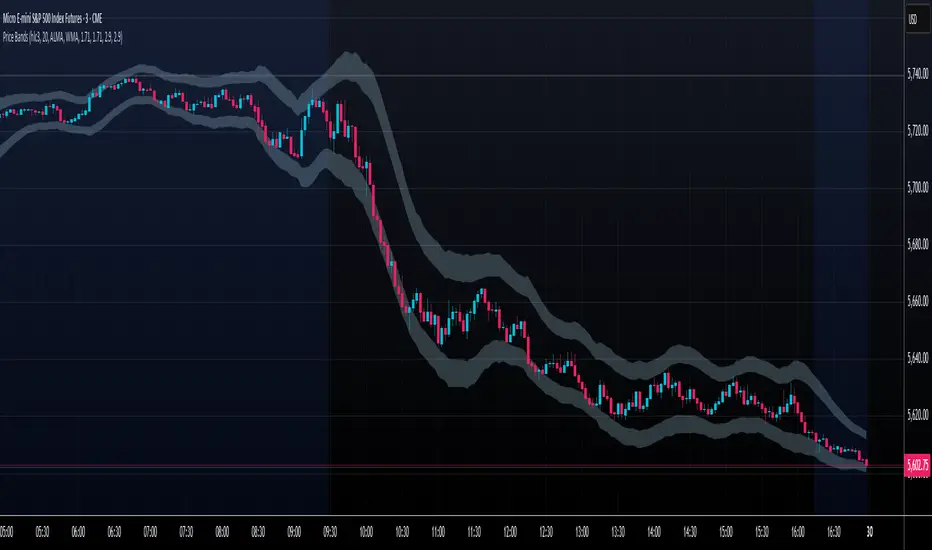
Price Extreme BandsPrice Extreme Bands Description
This indicator calculates and displays Price Extreme Bands based on an Exponential Moving Average (EMA) and True Range Average True Range (TR ATR). It utilizes a custom "Super Smoother" function to smooth the bands, providing a clearer representation of potential price extremes without sacrificing accuracy.
Usage
Built for specifically for intraday timeframes, this indicator identifies short term price extremes and volatility ranges. Traders can observe when price moves towards the outer bands, suggesting strong momentum or potential overbought/oversold conditions. The filled zones highlight areas of increased volatility which can used as exit criteria for a trade, possible reversal points in ranging markets or price ranges where price momentum could slow in trending markets.
Key Features
Length Input: Controls the length of the EMA and TR ATR calculations.
Multiplier Inputs: Uses two fixed multipliers (1.71 and 2.50) to create bands.
Super Smoother: Applies a custom smoothing function to the bands for reduced noise.
Fill Zones: Fills the areas between the inner and outer bands to highlight potential volatility ranges.
Calculation:
1. EMA (Basis): Calculates the Exponential Moving Average of the selected source.
2. TR ATR: Calculates the True Range and then smoothes it using RMA (Rolling Moving Average).
3. Bands: Calculates upper and lower bands using the EMA and ATR, with multipliers of 1.71 and 2.50.
4. Super Smoother: Applies a smoothing function to the calculated bands.
Visuals:
Basis Line: Plots the EMA (basis) (invisible by default).
Inner Bands (1.71 Multiplier): Plots the smoothed bands with a distinct color (e.g., orange) (invisible by default).
Outer Bands (2.50 Multiplier): Plots the smoothed bands with a different color (e.g., purple) (invisible by default).
Fill Zones: Fills the region between the inner and outer upper bands and the inner and outer lower bands with a translucent color (e.g. light blue).
// Note: The plot lines are invisible by default. To view the basis, upper and lower band lines, adjust the visibility settings in the indicator's settings.
Uniqueness: Ready of the box. Code and parameters built specifically for 1m to 15m timeframes provides users with an indicator to easily identify price extremes. The use of TR ATR and addition of the Super Smoother calculation create a easier visualization and implementation compared to existing price band options.
Dual Keltner Channels Strategy [Eastgate3194]This strategy utilised 2 Keltner Channels to perform counter trade.
The strategy have 2 steps:
Long Position:
Step 1. Close price must cross under Outer Lower band of Keltner Channel.
Step 2. Close price cross over Inner Lower band of Keltner Channel.
Short Position:
Step 1. Close price must cross over Outer Upper band of Keltner Channel.
Step 2. Close price cross under Inner Upper band of Keltner Channel.

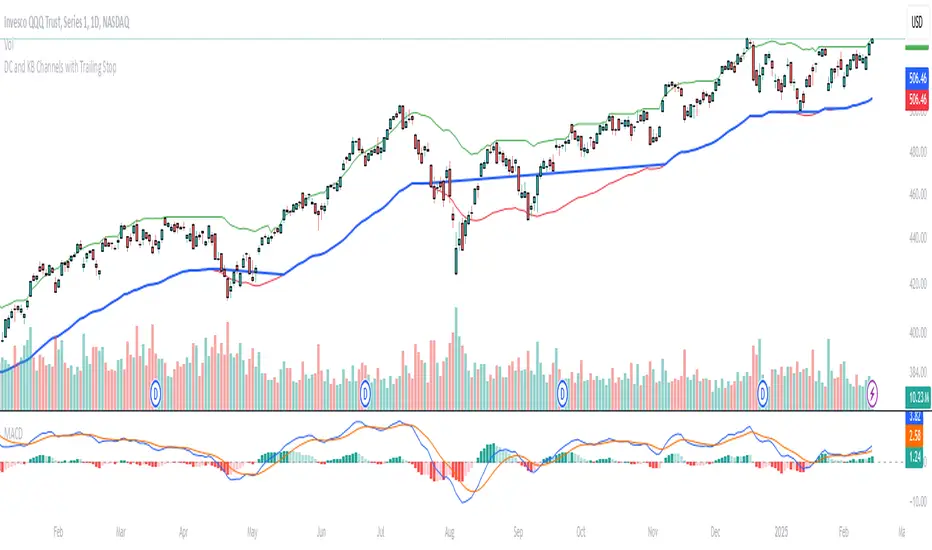
Donchian and Keltner Channels Trend Following with Trailing StopLong Only Trend-following model based on Keltner Channels and Donchian Channels.
These indicators include a noise region, which allows prices to oscillate without requiring position adjustments.
When price trades above the upper band, it signals strength; when it trades below the lower band, it signals weakness.
Keltner Channels
Keltner Channels are volatility-based envelopes set above and below an exponential moving average. Keltner Channels use the Average True Range (ATR), which measures daily volatility, to set channel distance.
Donchian Channel
Donchian Channels are are used to identify market trends and volatility. The upper and lower bands are based on the highest high and lowest low of a specified period. When the price moves above the upper band, it indicates a bullish breakout, while a
move below the lower band indicates a bearish breakout. The distance between the upper and lower channel of the Donchian Channel indicates the asset’s volatility.
Trend Following Model
The default settings are:
Upper Keltner and Upper Donchian Channel Length : 20
Lower Keltner and Lower Donchian Channel Length : 40
Keltner ATR Multiplier: 2
Entries, Exits and Trailing Stop
Entry : When price exceeds the upper band of at least one of these indicators.
Exit : When price undercuts the lower band of at least one of these indicators.
Trailing Stop : See below.
Trailing Stop
This is a stop-loss order that moves with the price of the underlying. It is designed to “trail” the price up (in the case of a long position) or down (for a short position), locking in profits as the price moves in a favorable direction.
At the end of day t, there was a Trailing Stop level in place. For the next day (day t + 1), the Trailing Stop will be adjusted. The new Trailing Stop will be the higher of two values:
The Trailing Stop from the previous day (day t).
The Lower Band computed at the end of day t + 1.
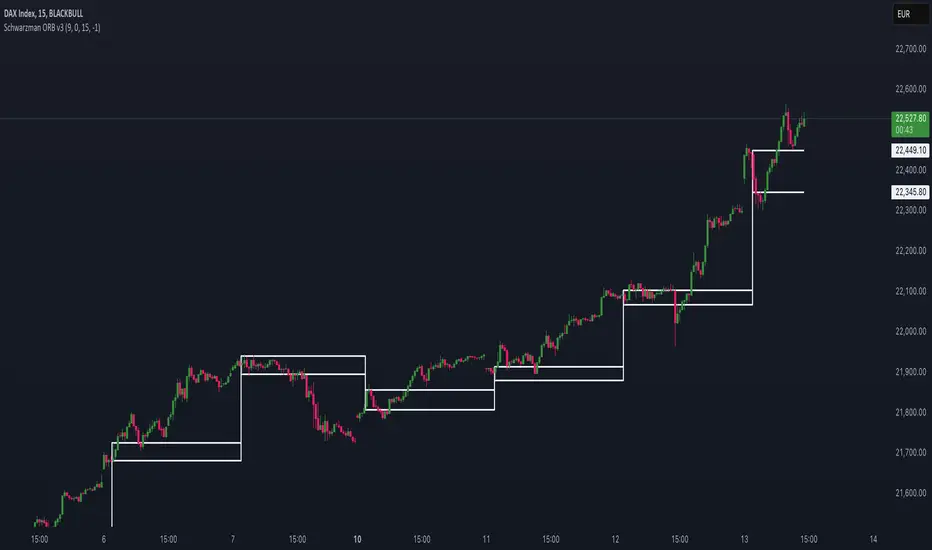
Schwarzman Custom ORB with Box DisplayIndicator Overview
The Schwarzman Custom ORB (Opening Range Breakout) Indicator is a fully self-developed script designed for traders who utilize opening range breakout strategies. This indicator allows users to customize their ORB settings, apply them to historical price data, and visually connect multiple ORBs to analyze past performance. The goal is to provide traders with a tool to backtest and refine their breakout strategies based on historical ORB data.
How the Indicator Works
1️⃣ User-Defined ORB Settings
• The user selects a custom start time (hour and minute) for the ORB.
• The user defines a duration (e.g., 15 minutes, 30 minutes, etc.) for the ORB period.
• A timezone offset is included to adjust for different market sessions.
2️⃣ ORB High and Low Calculation
• The script records the highest and lowest prices within the selected ORB time window.
• The recorded values remain static after the ORB period ends, ensuring accurate range plotting.
3️⃣ Historical ORB Visualization
• Instead of only showing a single ORB for the current session, this indicator connects multiple ORBs across past data.
• This allows traders to visually analyze previous breakout performance.
• The plotted ORBs remain fixed and do not repaint, ensuring an accurate backtesting experience.
4️⃣ Stepline Visualization & Range Filling
• The high and low ORB levels are displayed using stepline plots to maintain clear horizontal levels.
• A shaded box is applied between the ORB high and low for better visualization.
Use Cases & Strategy Application
📌 Backtesting Historical ORBs – See how past ORBs performed under different market conditions.
📌 Custom ORB Settings – Adjust the start time and duration for different trading sessions.
📌 Multi-ORB Analysis – Connect ORBs over multiple trading days to study trends and breakouts.
📌 Breakout Strategy Optimization – Use the historical ORB connections to refine entry and exit points.
This indicator is particularly useful for day traders, scalpers, and breakout traders looking for a data-driven approach to trading.
Indicator Development & Transparency Statement
As a trader, I have tested various ORB (Opening Range Breakout) indicators available in the TradingView community. Through these experiences, I aimed to develop a version that best fits my own trading needs and strategy.
This script is a self-developed ORB tool, created from scratch while drawing inspiration from the concept of opening range breakouts, which is widely used in trading. Since I initially coded in Pine Script v4, I used ChatGPT to help refine and migrate the script to Pine Script v6 to ensure compatibility with the latest TradingView features. However, the core logic, structure, and customization were entirely designed and implemented based on my own approach.
I am making this indicator public not to violate any TradingView guidelines but to share my work with the trading community and provide a tool that can help others analyze ORB-based strategies. If there are any compliance concerns, I am open to adjusting the script accordingly, but I want to clarify that this is not a copy of any existing ORB script—it is a custom-built indicator tailored to my own trading preferences.
I appreciate the opportunity to contribute to the community and would welcome any specific feedback from TradingView regarding rule compliance.
Best regards,
Janko S. (Schwarzman)
Appeal to TradingView
Dear TradingView Team,
This script is 100% self-developed and does not copy or replicate any third-party code. It is a customized ORB tool designed for traders who wish to backtest and analyze opening range breakout strategies over multiple sessions. We kindly request specific clarification regarding which exact line(s) of code violate TradingView’s guidelines. If there are any compliance concerns, we are happy to adjust the script accordingly.
Please let us know the precise rules or community guidelines that were violated so we can make the necessary modifications.
🚀 Summary
✔ Fully Custom & Self-Developed – No copied or third-party code.
✔ Innovative Feature – Connects past ORBs for strategy backtesting.
✔ Transparent & Compliant – Requesting exact details on any potential rule violations.
WhalenatorThis custom TradingView indicator combines multiple analytic techniques to help identify potential market trends, areas of support and resistance, and zones of heightened trading activity. It incorporates a SuperTrend-like line based on ATR, Keltner Channels for volatility-based price envelopes, and dynamic order blocks derived from significant volume and pivot points. Additionally, it highlights “whale” activities—periods of exceptionally large volume—along with an estimated volume profile level and approximate bid/ask volume distribution. Together, these features aim to offer traders a more comprehensive view of price structure, volatility, and institutional participation.
This custom TradingView indicator integrates multiple trading concepts into a single, visually descriptive tool. Its primary goal is to help traders identify directional bias, volatility levels, significant volume events, and potential support/resistance zones on a price chart. Below are the main components and their functionalities:
SuperTrend-Like Line (Trend Bias):
At the core of the indicator is a trend-following line inspired by the SuperTrend concept, which uses Average True Range (ATR) to adaptively set trailing stop levels. By comparing price to these levels, the line attempts to indicate when the market is in an uptrend (price above the line) or a downtrend (price below the line). The shifting levels can provide a dynamic sense of direction and help traders stay with the predominant trend until it shifts.
Keltner Channels (Volatility and Range):
Keltner Channels, based on an exponential moving average and Average True Range, form volatility-based envelopes around price. They help traders visualize whether price is extended (touching or moving outside the upper/lower band) or trading within a stable range. This can be useful in identifying low-volatility consolidations and high-volatility breakouts.
Dynamic Order Blocks (Approximations of Supply/Demand Zones):
By detecting pivot highs and lows under conditions of significant volume, the indicator approximates "order blocks." Order blocks are areas where institutional buying or selling may have occurred, potentially acting as future support or resistance zones. Although these approximations are not perfect, they offer a visual cue to areas on the chart where price might react strongly if revisited.
Volume Profile Proxy and Whale Detection:
The indicator highlights price levels associated with recent maximum volume activity, providing a rough "volume profile" reference. Such levels often become key points of price interaction.
"Whale" detection logic attempts to identify bars where exceptionally large volume occurs (beyond a defined threshold). By tracking these "whale bars," traders can infer where heavy participation—often from large traders or institutions—may influence market direction or create zones of interest.
Approximate Bid/Ask Volume and Dollar Volume Tracking:
The script estimates whether volume within each bar leans more towards the bid or the ask side, aiming to understand which participant (buyers or sellers) might have been more aggressive. Additionally, it calculates dollar volume (close price multiplied by volume) and provides an average to gauge the relative participation strength over time.
Labeling and Visual Aids:
Dynamic labels display Whale Frequency (the ratio of bars with exceptionally large volume), average dollar volume, and approximate ask/bid volume metrics. This gives traders at-a-glance insights into current market conditions, participation, and sentiment.
Strengths:
Multifaceted Analysis:
By combining trend, volatility, volume, and order block logic in one place, the indicator saves chart space and simplifies the analytical process. Traders gain a holistic view without flipping between multiple separate tools.
Adaptable to Market Conditions:
The use of ATR and Keltner Channels adapts to changing volatility conditions. The SuperTrend-like line helps keep traders aligned with the prevailing trend, avoiding constant whipsaws in choppy markets.
Volume-Based Insights:
Integrating whale detection and a crude volume profile proxy helps traders understand where large players might be interacting. This perspective can highlight critical levels that might not be evident from price action alone.
Convenient Visual Cues and Labels:
The indicator provides quick reference points and textual information about the underlying volume dynamics, making decision-making potentially faster and more informed.
Weaknesses:
Heuristic and Approximate Nature:
Many of the indicator’s features, like the "order blocks," "whale detection," and the approximate bid/ask volume, rely on heuristics and assumptions that may not always be accurate. Without actual Level II data or true volume profiles, the insights are best considered as supplementary, not definitive signals.
Lagging Components:
Indicators that rely on past data, like ATR-based trends or moving averages for Keltner Channels, inherently lag behind price. This can cause delayed signals, particularly in fast-moving markets, potentially missing some early opportunities or late in confirming market reversals.
No Guaranteed Predictive Power:
As with any technical tool, it does not forecast the future with certainty. Strong volume at a certain level or a bullish SuperTrend reading does not guarantee price will continue in that direction. Market conditions can change unexpectedly, and false signals will occur.
Complexity and Overreliance Risk:
With multiple signals combined, there’s a risk of information overload. Traders might feel compelled to rely too heavily on this one tool. Without complementary analysis (fundamentals, news, or additional technical confirmation), overreliance on the indicator could lead to misguided trades.
Conclusion:
This integrated indicator offers a comprehensive visual guide to market structure, volatility, and activity. Its strength lies in providing a multi-dimensional viewpoint in a single tool. However, traders should remain aware of its approximations, inherent lags, and the potential for conflicting signals. Sound risk management, position sizing, and the use of complementary analysis methods remain essential for trading success.
Risks Associated with Trading:
No indicator can guarantee profitable trades or accurately predict future price movements. Market conditions are inherently unpredictable, and reliance on any single tool or combination of tools carries the risk of financial loss. Traders should practice sound risk management, including the use of stop losses and position sizing, and should not trade with funds they cannot afford to lose. Ultimately, decisions should be guided by a thorough trading plan and possibly supplemented with other forms of market analysis or professional advice.
Risks and Important Considerations:
• Not a Standalone Tool:
• This indicator should not be used in isolation. It is essential to incorporate additional technical analysis tools, fundamental analysis, and market context when making trading decisions.
• Relying solely on this indicator may lead to incomplete assessments of market conditions.
• Market Volatility and False Signals:
• Financial markets can be highly volatile, and indicators based on historical data may not accurately predict future movements.
• The indicator may produce false signals due to sudden market changes, low liquidity, or atypical trading activity.
• Risk Management:
• Always employ robust risk management strategies, including setting stop-loss orders, diversifying your portfolio, and not over-leveraging positions.
• Understand that no indicator guarantees success, and losses are a natural part of trading.
• Emotional Discipline:
• Avoid making impulsive decisions based on indicator signals alone.
• Emotional trading can lead to significant financial losses; maintain discipline and adhere to a well-thought-out trading plan.
• Continuous Learning and Adaptation:
• Stay informed about market news, economic indicators, and global events that may impact trading conditions.
• Continuously evaluate and adjust your trading strategies as market dynamics evolve.
• Consultation with Professionals:
• Consider seeking advice from financial advisors or professional traders to understand better how this indicator can fit into your overall trading strategy.
• Professional guidance can provide personalized insights based on your financial goals and risk tolerance.
Disclaimer:
Trading financial instruments involves substantial risk and may not be suitable for all investors. Past performance is not indicative of future results. This indicator is provided for informational and educational purposes only and should not be considered investment advice. Always conduct your own research and consult with a licensed financial professional before making any trading decisions.
Note: The effectiveness of any technical indicator can vary based on market conditions and individual trading styles. It's crucial to test indicators thoroughly using historical data and possibly paper trading before applying them in live trading scenarios.

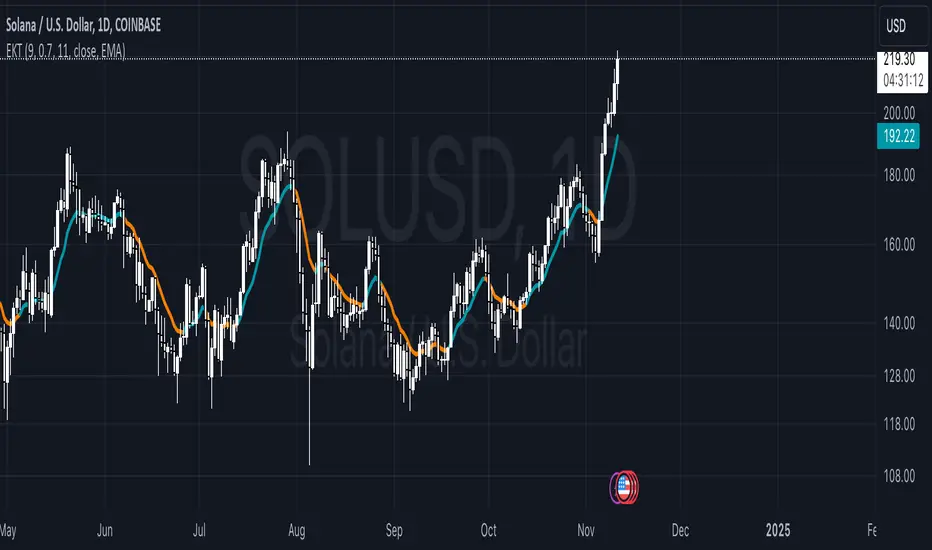
Enhanced Keltner TrendThe Enhanced Keltner Trend (EKT) indicator builds on the classic Keltner Channel, using volatility to define potential trend channels around a central moving average. It combines customizable volatility measures moving average, giving traders flexibility to adapt the trend channel to various market conditions.
How It Works?
MA Calculation:
A user-defined moving average forms the central line (or price basis) of the Keltner Channel.
Channel Width:
The width of the Keltner Channel depends on market volatility.
You can choose between two methods for measuring the volatility:
ATR-based Width: Uses the Average True Range (ATR) with customizable periods and multipliers.
Price Range Width: Uses the high and low price range over a defined period.
Trend Signal:
The trend is evaluated by price in relation to the Keltner Channel:
Bullish Trend (Blue Line): When the price crosses above the upper band, it signals upward momentum.
Bearish Trend (Orange Line): When the price crosses below the lower band, it signals downward momentum.
What Is Unique?
This Enhanced version of the Keltner Trend is for investors who want to have more control over the Keltner's channels calculation, so they can calibrate it to provide them more alpha when combined with other Technical Indicators.
Use ATR: Gives the user the choice to use the ATR for the channel width calculation, or use the default High - Low over specified period.
ATR Period: Users can modify ATR length to calculate the channels width (Volatility).
ATR Multiplier: Users can fine-tune how much of the volatility they want to factor into the channels, providing more control over the final calculation.
MA Period: Smoothing period for the Moving Averages.
MA Type: Choosing from different Moving Averages types providing different smoothing types.
Setting Alerts:
Built-in alerts for trend detection:
Bullish Trend: When price crosses the upper band, it signals a Bullish Signal (Blue Color)
Bearish Trend: When price crosses the lower band, it signals a Bearish Signal (Orange Color)
Credits to @jaggedsoft , it's a modified version of his.
The Bar Counter Trend Reversal Strategy [TradeDots]Overview
The Bar Counter Trend Reversal Strategy is designed to identify potential counter-trend reversal points in the market after a series of consecutive rising or falling bars.
By analyzing price movements in conjunction with optional volume confirmation and channel bands (Bollinger Bands or Keltner Channels), this strategy aims to detect overbought or oversold conditions where a trend reversal may occur.
🔹How it Works
Consecutive Price Movements
Rising Bars: The strategy detects when there are a specified number of consecutive rising bars (No. of Rises).
Falling Bars: Similarly, it identifies a specified number of consecutive falling bars (No. of Falls).
Volume Confirmation (Optional)
When enabled, the strategy checks for increasing volume during the consecutive price movements, adding an extra layer of confirmation to the potential reversal signal.
Channel Confirmation (Optional)
Channel Type: Choose between Bollinger Bands ("BB") or Keltner Channels ("KC").
Channel Interaction: The strategy checks if the price interacts with the upper or lower channel lines: For short signals, it looks for price moving above the upper channel line. For long signals, it looks for price moving below the lower channel line.
Customization:
No. of Rises/Falls: Set the number of consecutive bars required to trigger a signal.
Volume Confirmation: Enable or disable volume as a confirmation factor.
Channel Confirmation: Enable or disable channel bands as a confirmation factor.
Channel Settings: Adjust the length and multiplier for the Bollinger Bands or Keltner Channels.
Visual Indicators:
Entry Signals: Triangles plotted on the chart indicate potential entry points:
Green upward triangle for long entries.
Red downward triangle for short entries.
Channel Bands: The upper and lower bands are plotted for visual reference.
Strategy Parameters:
Initial Capital: $10,000.
Position Sizing: 80% of equity per trade.
Commission: 0.01% per trade to simulate realistic trading costs.
🔹Usage
Set up the number of Rises/Falls and choose whether if you want to use channel indicators and volume as the confirmation.
Monitor the chart for triangles indicating potential entry points.
Consider the context of the overall market trend and other technical factors.
Backtesting and Optimization:
Use TradingView's Strategy Tester to evaluate performance.
Adjust parameters to optimize results for different market conditions.
🔹 Considerations and Recommendations
Risk Management:
The strategy does not include built-in stop-loss or take-profit levels. It's recommended to implement your own risk management techniques.
Market Conditions:
Performance may vary in different market environments. Testing and adjustments are advised when applying the strategy to new instruments or timeframes.
No Guarantee of Future Results:
Past performance is not indicative of future results. Always perform due diligence and consider the risks involved in trading.

Polynomial Regression Keltner Channel [ChartPrime]Polynomial Regression Keltner Channel
⯁ OVERVIEW
The Polynomial Regression Keltner Channel [ ChartPrime ] indicator is an advanced technical analysis tool that combines polynomial regression with dynamic Keltner Channels. This indicator provides traders with a sophisticated method for trend analysis, volatility assessment, and identifying potential overbought and oversold conditions.
◆ KEY FEATURES
Polynomial Regression: Uses polynomial regression for trend analysis and channel basis calculation.
Dynamic Keltner Channels: Implements Keltner Channels with adaptive volatility-based bands.
Overbought/Oversold Detection: Provides visual cues for potential overbought and oversold market conditions.
Trend Identification: Offers clear trend direction signals and change indicators.
Multiple Band Levels: Displays four levels of upper and lower bands for detailed market structure analysis.
Customizable Visualization: Allows toggling of additional indicator lines and signals for enhanced chart analysis.
◆ FUNCTIONALITY DETAILS
⬥ Polynomial Regression Calculation:
Implements a custom polynomial regression function for trend analysis.
Serves as the basis for the Keltner Channel, providing a smoothed centerline.
//@function Calculates polynomial regression
//@param src (series float) Source price series
//@param length (int) Lookback period
//@returns (float) Polynomial regression value for the current bar
polynomial_regression(src, length) =>
sumX = 0.0
sumY = 0.0
sumXY = 0.0
sumX2 = 0.0
sumX3 = 0.0
sumX4 = 0.0
sumX2Y = 0.0
n = float(length)
for i = 0 to n - 1
x = float(i)
y = src
sumX += x
sumY += y
sumXY += x * y
sumX2 += x * x
sumX3 += x * x * x
sumX4 += x * x * x * x
sumX2Y += x * x * y
slope = (n * sumXY - sumX * sumY) / (n * sumX2 - sumX * sumX)
intercept = (sumY - slope * sumX) / n
n - 1 * slope + intercept
⬥ Dynamic Keltner Channel Bands:
Calculates ATR-based volatility for dynamic band width adjustment.
Uses a base multiplier and adaptive volatility factor for flexible band calculation.
Generates four levels of upper and lower bands for detailed market structure analysis.
atr = ta.atr(length)
atr_sma = ta.sma(atr, 10)
// Calculate Keltner Channel Bands
dynamicMultiplier = (1 + (atr / atr_sma)) * baseATRMultiplier
volatility_basis = (1 + (atr / atr_sma)) * dynamicMultiplier * atr
⬥ Overbought/Oversold Indicator line and Trend Line:
Calculates an OB/OS value based on the price position relative to the innermost bands.
Provides visual representation through color gradients and optional signal markers.
Determines trend direction based on the polynomial regression line movement.
Generates signals for trend changes, overbought/oversold conditions, and band crossovers.
◆ USAGE
Trend Analysis: Use the color and direction of the basis line to identify overall trend direction.
Volatility Assessment: The width and expansion/contraction of the bands indicate market volatility.
Support/Resistance Levels: Multiple band levels can serve as potential support and resistance areas.
Overbought/Oversold Trading: Utilize OB/OS signals for potential reversal or pullback trades.
Breakout Detection: Monitor price crossovers of the outermost bands for potential breakout trades.
⯁ USER INPUTS
Length: Sets the lookback period for calculations (default: 100).
Source: Defines the price data used for calculations (default: HLC3).
Base ATR Multiplier: Adjusts the base width of the Keltner Channels (default: 0.1).
Indicator Lines: Toggle to show additional indicator lines and signals (default: false).
⯁ TECHNICAL NOTES
Implements a custom polynomial regression function for efficient trend calculation.
Uses dynamic ATR-based volatility adjustment for adaptive channel width.
Employs color gradients and opacity levels for intuitive visual representation of market conditions.
Utilizes Pine Script's plotchar function for efficient rendering of signals and heatmaps.
The Polynomial Regression Keltner Channel indicator offers traders a sophisticated tool for trend analysis, volatility assessment, and trade signal generation. By combining polynomial regression with dynamic Keltner Channels, it provides a comprehensive view of market structure and potential trading opportunities. The indicator's adaptability to different market conditions and its customizable nature make it suitable for various trading styles and timeframes.

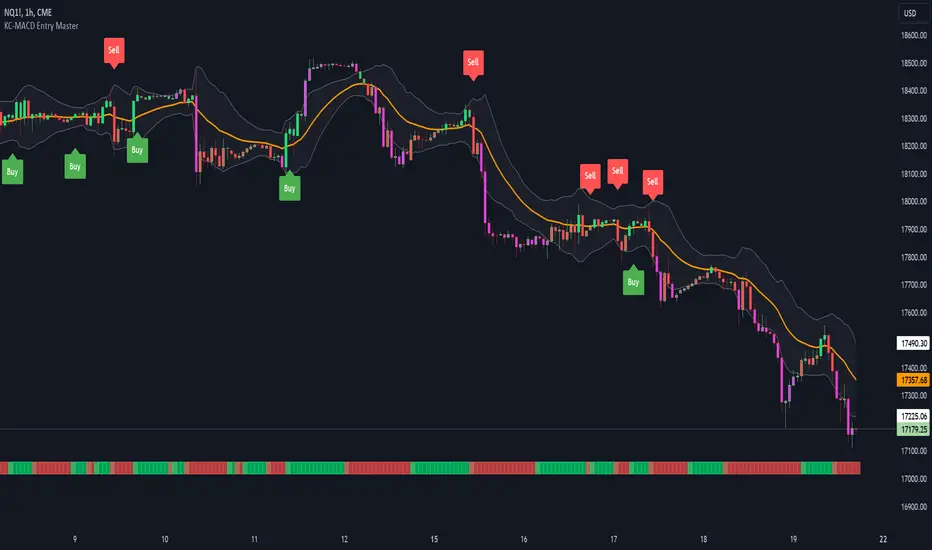
KC-MACD Entry Master @shrilssThe KC-MACD Entry Master is designed to enhance trading strategies by utilizing Keltner Channels and MACD for dynamic market analysis. This indicator excels in visually identifying market conditions with a sophisticated bar coloring system and an informative MACD Traffic Light feature.
Key Features:
- Dynamic Bar Coloring: The core feature of this indicator is its ability to adjust the color of bars based on their positioning relative to the Keltner Channels and the EMA (Exponential Moving Average). It colors bars lime or red when the closing price is within the Keltner Channels but above or below the EMA, respectively. Additionally, it uses a fuchsia color to indicate breakouts when the price extends beyond the Keltner Channels. This visual aid helps traders quickly identify potential buying or selling opportunities based on market volatility and price action.
- MACD Traffic Light: Positioned at the bottom of the chart, this unique feature displays the histogram color of the MACD, set by default to a 3/10/16 configuration—known as the 3-10 Oscillator. This Traffic Light gives traders an at-a-glance view of the underlying momentum and trend shifts, further aiding in decision-making processes.
- MACD-Based Entry Signals: By calculating the fast and slow moving averages specified by the user, the script determines MACD values and their crossover with a smoothed signal line. Entry points are then highlighted with shapes (e.g., "Buy" or "Sell") plotted on the chart when conditions are met, including alignment with the bar colors for enhanced accuracy.
ATR Bands (Keltner Channel), Wick and SRSI Signals [MW]Introduction
This indicator uses a novel combination of ATR Bands, candle wicks crossing the ATR upper and lower bands, and baseline, and combines them with the Stochastic SRSI oscillator to provide early BUY and SELL signals in uptrends, downtrends, and in ranging price conditions.
How it’s unique
People generally understand Bollinger Bands and Keltner Channels. Buy at the bottom band, sell at the top band. However, because the bands themselves are not static, impulsive moves can render them useless. People also generally understand wicks. Candles with large wicks can represent a change in pattern, or volatile price movement. Combining those two to determine if price is reaching a pivot point is relatively novel. When Stochastic RSI (SRSI) filtering is also added, it becomes a genuinely unique combination that can be used to determine trade entries and exits.
What’s the benefit
The benefit of the indicator is that it can help potentially identify pivots WHEN THEY HAPPEN, and with potentially minimal retracement, depending on the trader’s time window. Many indicators wait for a trend to be established, or wait for a breakout to occur, or have to wait for some form of confirmation. In the interpretation used by this indicator, bands, wicks, and SRSI cycles provide both the signal and confirmation.
It takes into account 3 elements:
Price approaching the upper or lower band or the baseline - MEANING: Price is becoming extended based on calculations that use the candle trading range.
A candle wick of a defined proportion (e.g. wick is 1/2 the size of a full candle OR candle body) crosses a band or baseline, but the body does not cross the band or baseline - MEANING: Buyers and sellers are both very active.
The Stochastic RSI reading is above 80 for SELL signals and below 20 for BUY signals - MEANING: Additional confirmation that price is becoming extended based on the current cyclic price pattern.
How to Use
SIGNALS
Buy Signals - Green(ish):
B Signal - Potential pivot up from the lower band when using the preferred multiplier
B1 Signal - Potential pivot up from the lower band when using phi * multiplier
B2 Signal - Potential pivot up from the lower band when using 1/2 * multiplier
B3 Signal - Potential pivot up from baseline
Sell Signals - Red(ish):
S Signal - Potential pivot down from the upper band when using the preferred multiplier
S1 Signal - Potential pivot down from the upper band when using
S2 Signal - Potential pivot down from the upper band when using 1/2 * multiplier
S3 Signal - Potential pivot down from the baseline
DISCUSSION
During an uptrend or downtrend, signals from the baseline can help traders identify areas where they may enter the trending move with the least amount of drawdown. In both cases, entry points can occur with baseline signals in the direction of the trend.
For example, in an uptrend (when the price is forming higher highs and higher lows, or when the baseline is rising), price tends to oscillate between the upper band and baseline. In this case, the baseline BUY signal (B3) can show an entry point.
In a downtrend (when the price is forming lower highs and lower lows, or when the baseline is falling), price tends to oscillate between the baseline and the lower band. In this case, the baseline SELL signal (S3) can show an entry point.
During consolidation, when price is ranging, price tends to oscillate between the upper and lower bands, while crossing through the baseline unperturbed. Here, entry points can occur at the upper and lower bands.
When all conditions are met at the lower band during consolidation, a BUY signal (B), can occur. This signal may also occur prior to a break out of consolidation to the upside.
When all conditions are met at the upper band during consolidation, a SELL signal (S), can occur. This signal may also occur prior to a break out of consolidation to the downside.
Additional B1, B2, and S1, and S2 signals can be displayed that use the bands based on a multiplier that is half that of the primary one, and phi (0.618) times the primary multiplier as a way to quickly check for signals occurring along different, but related, bands.
Calculations
ATR Bands, or Keltner Channels, are a technical analysis tool that are used to measure market volatility and identify overbought or oversold conditions in the trading of financial instruments, such as stocks, bonds, commodities, and currencies. ATR Bands consist of three lines plotted on a price chart:
Middle Band, Basis, or Baseline: This is typically a simple moving average (SMA) of the closing prices over a certain period. It represents the intermediate-term trend of the asset's price.
Upper Band: This is calculated by adding a certain number of ATRs to the middle band (SMA). The upper band adjusts itself with the increase in volatility.
Lower Band: This is calculated by subtracting the same number of ATRs from the middle band (SMA). Like the upper band, the lower band adjusts to changes in volatility.
The candle wick signals occur if the wick is at the specified ratio compared to either the entire candle or the candle body. The upper band, lower band, and baseline signals happen if the wick is the specified ratio of the total candle size. For the major signals for upper and lower bands, these occur when the wick extends outside of the bands while closing a candle inside of the bands. For the baseline signals, they occur if a wick crosses a baseline but closes on the other side.
Settings
CHANNEL SETTINGS
Baseline EMA Period (Default: 21): Period length of the moving average basis line.
ATR Period (Default: 21): The number of periods over which the Average True Range (ATR) is calculated.
Basis MA Type (Default: SMA): The moving average type for the basis line.
Multiplier (Default: 2.5: The deviation multiplier used to calculate the band distance from the basis line.
ADDITIONAL CHANNELS
Half of Multiplier Offset (Default: True): Toggles the display of the ATR bands that are set a distance of half of the ATR multiplier.
Quarter of Multiplier Offset (Default: false): Toggles the display of the ATR bands that are set a distance of one quarter of the ATR multiplier.
Phi (Φ) Offset (Default: false): Toggles the display of the ATR bands that are set a distance of phi (Φ) times the ATR multiplier.
WICK SETTINGS FOR CANDLE FILTERS
Wick Ratio for Bands (Default: 0.4): The ratio of wick size to total candle size for use at upper and lower bands.
Wick Ratio for Baseline (Default: 0.4): The ratio of wick size to total candle size for use at baseline.
Use Candle Body (rather than full candle size) (Default: false): Determines whether wick calculations use the candle body or the entire candle size.
VISUAL PREFERENCES - SIGNALS
Show Signals (Default: true): Allows signal labels to be shown.
Show Signals from 1/2 Band Offset (Default: false): Toggle signals originating from 1/2 offset upper and lower bands.
Show Signals from Phi (Φ) Band Offset (Default: false): Toggle signals originating from phi (Φ) offset upper and lower bands.
Show Baseline Signals (Default: false): Toggle Baseline signals.
VISUAL PREFERENCES - BANDS
Show ATR (Keltner) Bands (Default: true): Use a background color inside the Bollinger Bands.
Fill Bands (Default: true): Use a background color inside the Bollinger Bands.
STOCHASTIC SETTINGS
Use Stochastic RSI Filtering (Default: False): This will only trigger some SELL signals when the stochastic RSI is above 80, and BUY signals when below 20.
K (Default: 3): The smoothing level for the Stochastic RSI.
RSI Length (Default: 14): The period length for the RSI calculation.
Stochastic Length (Default: 8): The period length over which the stochastic calculation is performed.
Other Usage Notes and Limitations
To understand future price movement, this indicator assumes that 3 things must be known:
Evidence of a change of market structure. This can be demonstrated by increased volatility, consolidation, volume spikes (which can be tracked with the MW Volume Impulse Indicator) or, in the case of this indicator, candle wicks.
The potential cause of the change. It could be a VWAP line (which can be tracked with the Multi VWAP , and Multi VWAP from Gaps indicators), an event, an important support or resistance level, a key moving average, or many other things. This indicator assumes the ATR bands can be a cause.
The current position in the price cycle. Oscillators like the RSI, and MACD, are typical measures of price oscillation (other oscillators like the Price and Volume Stochastic Divergence indicator can also be useful). This indicator uses the Stochastic RSI oscillator to determine overbought and oversold conditions.
When evidence of the change appears, and the potential cause of the change is identified, and the price oscillation is at a favorable position for the desired trading direction, this indicator will generate a signal.
ATR Bands (or Keltner Channels) are used to determine when price might “revert to the mean”. Crossing, or being near the upper or lower band, can indicate an overbought or oversold condition, which could lead to a price reversal. By tracking the behavior of candle wicks during these events, we can see how active the battle is between buyers and sellers.
If the top of a wick is large, it may indicate that sellers are aggressively attempting to bring the price down. Conversely, if the bottom wick is large, it can indicate that buyers are actively trying to counter the price action caused by selling pressure.
When this wicking action occurs at times when price is not near the upper band, lower band, or baseline, it could indicate the presence of an important level. That could mean a nearby VWAP line, a supply or demand zone, a round price number, or a number of other factors. In any case, this wick may be the first indication of a price reversal.
Shorter baseline periods may be better for short period trading like scalping or day trading, while longer period baselines can show signals that are better suited to swing trading, or longer term investing.
It's important for traders to be aware of the limitations of any indicator and to use them as part of a broader, well-rounded trading strategy that includes risk management, fundamental analysis, and other tools that can help with reducing false signals, determining trend direction, and providing additional confirmation for a trade decision. Diversifying strategies and not relying solely on one type of indicator or analysis can help mitigate some of these risks.
The TradingView platform allows a maximum of 500 labels per chart. This means that if your settings allow for a lot of signals, labels for earlier ones may not appear if the total number of labels exceeds 500 for the chart.

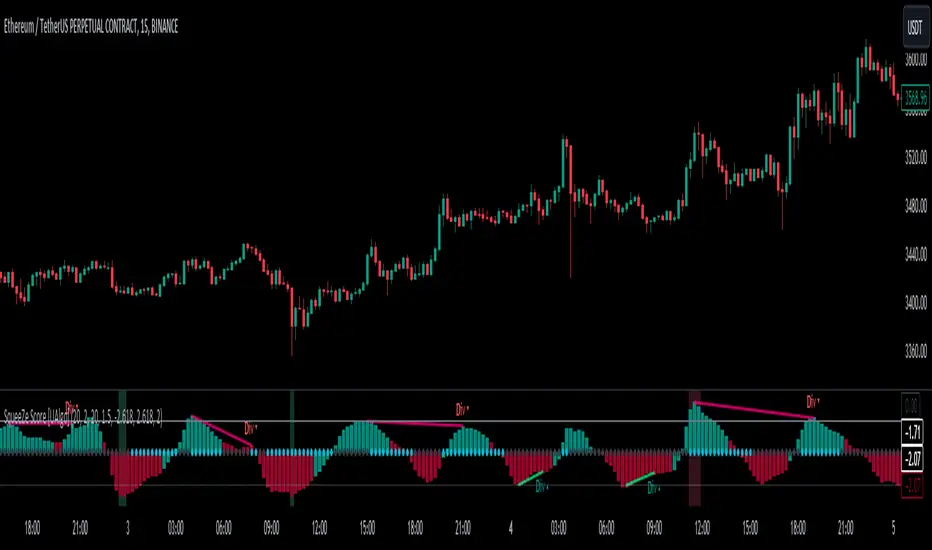
SqueeZe Score [UAlgo]The "SqueeZe Score" is a script based on the "Squeeze Momentum Indicator". It utilizes Bollinger Bands (BB) and Keltner Channels (KC) to identify periods of low volatility, indicating potential upcoming price movements. The Z-Score method is employed to measure deviations from the mean, highlighting extreme price movements within the context of the current volatility environment. This script provides traders with visual cues for potential bullish and bearish divergences, aiding in decision-making during trading activities.
🔶Key Features:
SqueeZe Settings: Users can customize parameters such as the length and multiplier factors for Bollinger Bands and Keltner Channels, providing flexibility to adapt the indicator to different trading strategies and market conditions.
Divergence Detection: The script includes options to detect and display both bullish and bearish divergences, providing additional insights into potential trend reversals or continuations.
Customizable Z-Score Thresholds: Thresholds for the Z-Score are user-defined, enabling traders to set levels at which extreme price movements are highlighted on the chart, facilitating quick identification of significant market conditions.
🔶Credit:
This script is inspired by the work of @LazyBear, who contributed to the original concept and development of the Squeeze Momentum indicator.
🔶Disclaimer:
- The information provided by this script is for educational and informational purposes only and should not be construed as financial advice.
- Users are encouraged to conduct their own research and analysis before making any investment decisions.
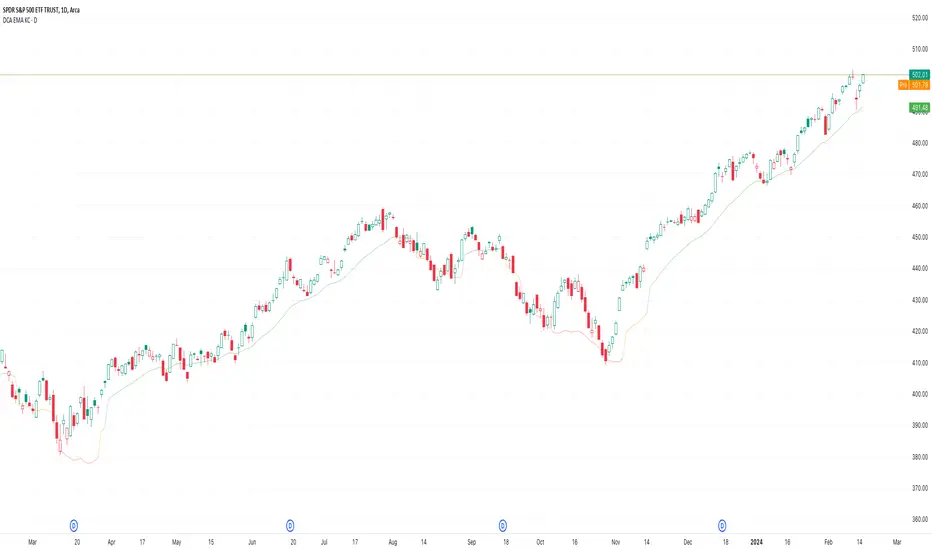
Variable Keltner Channel For DCAHello Everyone,
Sharing the indicator that I'm using for Dollar Cost Averaging into the stocks & ETFs in my portfolio.
Instead of entering regularly each month, entry only happens when the share price is below the indicator.
This indicator is based on Exponential Moving Average & Keltner Channel.
When 21 EMA is above 34 EMA, the line is 1 ATR below the 21 EMA. (green color)
When 21 EMA is below 34 EMA, the line is 2 ATR below the 21 EMA. (red color)
Exploring ways to refine this further, especially during sideways or transition to downtrend, do comment if you have any idea.
This strategy itself was based on SMA 50 strategy for DCA.
[KVA]Keltner Channel PercentageThe " Keltner Channel Percentage " (KC%) indicator, designed for TradingView's version 5 language, offers a unique perspective on market volatility and trend analysis, similar yet distinct from the well-known Bollinger Bands Percentage (BB%).
Audience and Applications:
This indicator is suited for traders who prefer a volatility-based approach but seek a smoother, trend-focused alternative to BB%.
It is especially valuable in markets where volatility is not just a byproduct but a central aspect of price dynamics.
In essence, the " Keltner Channel Percentage " stands as a complementary tool to Bollinger Bands Percentage. It offers a different lens through which to view market volatility and trends, providing traders with additional insights and strategies for navigating the financial markets. Its unique combination of simplicity and depth makes it a valuable addition to the technical analyst's toolkit, suitable for a variety of trading scenarios and market conditions.

PercentX Trend Follower [Trendoscope]"Trendoscope" was born from our trading journey, where we first delved into the world of trend-following methods. Over time, we discovered the captivating allure of pattern analysis and the exciting challenges it presented, drawing us into exploring new horizons. However, our dedication to trend-following methodologies remains steadfast and continues to be an integral part of our core philosophy.
Here we are, introducing another effective trend-following methodology, employing straightforward yet powerful techniques.
🎲 Concepts
Introducing the innovative PercentX Oscillator , a representation of Bollinger PercentB and Keltner Percent K. This powerful tool offers users the flexibility to customize their PercentK oscillator, including options for the type of moving average and length.
The Oscillator Range is derived dynamically, utilizing two lengths - inner and outer. The inner length initiates the calculation of the oscillator's highest and lowest range, while the outer length is used for further calculations, involving either a moving average or the opposite side of the highest/lowest range, to obtain the oscillator ranges.
Next, the Oscillator Boundaries are derived by applying another round of high/low or moving average calculations on the oscillator range values.
Breakouts occur when the close price crosses above the upper boundary or below the lower boundary, signaling potential trading opportunities.
🎲 How to trade a breakout?
To reduce false signals, we employ a simple yet effective approach. Instead of executing market trades, we use stop orders on both sides at a certain distance from the current close price.
In case of an upper side breakout, a long stop order is placed at 1XATR above the close, and a short stop order is placed at 2XATR below the close. Conversely, for a lower side breakout, a short stop order is placed at 1XATR below the close, and a long stop order is placed at 2XATR above the ATR. As a trend following method, our first inclination is to trade on the side of breakout and not to find the reversals. Hence, higher multiplier is used for the direction opposite to the breakout.
The script provides users with the option to specify ATR multipliers for both sides.
Once a trade is initiated, the opposite side of the trade is converted into a stop-loss order. In the event of a breakout, the script will either place new long and short stop orders (if no existing trade is present) or update the stop-loss orders if a trade is currently running.
As a trend-following strategy, this script does not rely on specific targets or target levels. The objective is to run the trade as long as possible to generate profits. The trade is only stopped when the stop-loss is triggered, which is updated with every breakout to secure potential gains and minimize risks.
🎲 Default trade parameters
Script uses 10% equity per trade and up to 4 pyramid orders. Hence, the maximum invested amount at a time is 40% of the equity. Due to this, the comparison between buy and hold does not show a clear picture for the trade.
Feel free to explore and optimize the parameters further for your favorite symbols.
🎲 Visual representation
The blue line represents the PercentX Oscillator, orange and lime colored lines represent oscillator ranges. And red/green lines represent oscillator boundaries. Oscillator spikes upon breakout are highlighted with color fills.
Williams %R + Keltner chanells - indicator (AS)1)INDICATOR ---This indicator is a combination of Keltner channels and Williams %R.
It measures trend using these two indicators.
When Williams %R is overbought(above upper line (default=-20)) and Keltner lower line is below price indicator shows uptrend (green).
When Williams %R is oversold(below lower line (default=-80)) and Keltner upper line is above price indicator shows downtrend (red) .
Can be turned into a strategy quickly.
2) CALCULATIONS:
Keltner basis is a choosen type of moving average and upper line is basis + (ATR*multiplier). Same with lower but minus instead of plus so basiss – (ATR*multiplier)
Second indicator
Williams %R reflects the level of the close relative to the highest high for the lookback period
3)PLS-HELP-----Looking for tips, ideas, sets of parameters, markets and timeframes, rules for strategy -------OVERALL -every advice you can have
4) SIGNALS-----buy signal is when price is above upper KC and Williams %R is above OVB(-20). Short is exactly the other way around
5) CUSTOMIZATION:
-%R-------LENGTH/SMOOTHING/TYPE SMOOTHING MA
-%R-------OVS/MID/OVB -(MID-no use for now)
-KC -------LENGTH/TYPE OF MAIN MA
-KC-------MULTIPLIER,ATR LENGTH
-OTHER--LENGTH/TYPE OF MA - (for signal filters, not used for now)
-OTHER--SOURCE -src of calculations
-OTHER--OVERLAY - plots %R values for debugging etc(ON by default)
6)WARNING - do not use this indicator on its own for trading
7)ENJOY
Volatility Compression BreakoutThe Volatility Compression Breakout indicator is designed to identify periods of low volatility followed by potential breakout opportunities in the market. It aims to capture moments when the price consolidates within a narrow range, indicating a decrease in volatility, and anticipates a subsequent expansion in price movement. This indicator can be applied to any financial instrument and timeframe.
When the close price is above both the Keltner Middle line and the Exponential Moving Average (EMA), the bars are colored lime green, indicating a potential bullish market sentiment. When the close price is positioned above the Keltner Middle but below the EMA, or below the Keltner Middle but above the EMA, the bars are colored yellow, signifying a neutral or indecisive market condition. Conversely, when the close price falls below both the Keltner Middle and the EMA, the bars are colored fuchsia, suggesting a potential bearish market sentiment.
Additionally, the coloration of the Keltner Middle line and the EMA provides further visual cues for assessing the trend. When the close price is above the Keltner Middle, the line is colored lime green, indicating a bullish trend. Conversely, when the close price is below the Keltner Middle, the line is colored fuchsia, highlighting a bearish trend. Similarly, the EMA line is colored lime green when the close price is above it, representing a bullish trend, and fuchsia when the close price is below it, indicating a bearish trend.
Parameters
-- Compression Period : This parameter determines the lookback period used to calculate the volatility compression. A larger value will consider a longer historical period for volatility analysis, potentially capturing broader market conditions. Conversely, a smaller value focuses on more recent price action, providing a more responsive signal to current market conditions.
-- Compression Multiplier : The compression multiplier is a factor applied to the Average True Range (ATR) to determine the width of the Keltner Channels. Increasing the multiplier expands the width of the channels, allowing for a larger price range before a breakout is triggered. Decreasing the multiplier tightens the channels and requires a narrower price range for a breakout signal.
-- EMA Period : This parameter sets the period for the Exponential Moving Average (EMA), which acts as a trend filter. The EMA helps identify the overall market trend and provides additional confirmation for potential breakouts. Adjusting the period allows you to capture shorter or longer-term trends, depending on your trading preferences.
How Changing Parameters Can Be Beneficial
Modifying the parameters allows you to adapt the indicator to different market conditions and trading styles. Increasing the compression period can help identify broader volatility patterns and major market shifts. On the other hand, decreasing the compression period provides more precise and timely signals for short-term traders.
Adjusting the compression multiplier affects the width of the Keltner Channels. Higher multipliers increase the breakout threshold, filtering out smaller price movements and providing more reliable signals during significant market shifts. Lower multipliers make the indicator more sensitive to smaller price ranges, generating more frequent but potentially less reliable signals.
The EMA period in the trend filter helps you align your trades with the prevailing market direction. Increasing the EMA period smoothes out the trend, filtering out shorter-term fluctuations and focusing on more sustained moves. Decreasing the EMA period allows for quicker responses to changes in trend, capturing shorter-term price swings.
Potential Downsides
While the Volatility Compression Breakout indicator can provide valuable insights into potential breakouts, it's important to note that no indicator guarantees accuracy or eliminates risk. False breakouts and whipsaw movements can occur, especially in volatile or choppy market conditions. It is recommended to combine this indicator with other technical analysis tools and consider fundamental factors to validate potential trade opportunities.
Making It Work for You
To maximize the effectiveness of the Volatility Compression Breakout indicator, consider the following:
-- Combine it with other indicators : Use complementary indicators such as trend lines, oscillators, or support and resistance levels to confirm signals and increase the probability of successful trades.
-- Practice risk management : Set appropriate stop-loss levels to protect your capital in case of false breakouts or adverse price movements. Consider implementing trailing stops or adjusting stop-loss levels as the trade progresses.
-- Validate with price action : Analyze the price action within the compression phase and look for signs of building momentum or weakening trends. Support your decisions by observing candlestick patterns and volume behavior during the breakout.
-- Backtest and optimize : Test the indicator's performance across different timeframes and market conditions. Optimize the parameters based on historical data to find the most suitable settings for your trading strategy.
Remember, no single indicator can guarantee consistent profitability, and it's essential to use the Volatility Compression Breakout indicator as part of a comprehensive trading plan. Regularly review and adapt your strategy based on market conditions and your trading experience. Monitor the indicator's performance and make necessary adjustments to parameter values if the market dynamics change.
By adjusting the parameters and incorporating additional analysis techniques, you can customize the indicator to suit your trading style and preferences. However, it is crucial to exercise caution, conduct thorough analysis, and practice proper risk management to increase the likelihood of successful trades. Remember that no indicator can guarantee profits, and continuous learning and adaptation are key to long-term trading success.

Keltner Trend V3It's just a simple keltner trend with options added to:
Eradicate repainting
more MAs
Json alerts (useful for bots)
I recommend using "open" option for all sources if you are going to use it with a bot, or if you want to be safe and enter with confirmations. Using the default settings would also show you all the entries without repainting as it uses high and low prices to check breakouts and not solely the close price (which is generally a false representative in historic analysis).
My favorite lengths are 7, 14, and 21. There is no specific reason, they just seem to work well most of the time. You can (and should) optimize it to your purposes.
Thanks to the original author @jaggedsoft this script is just a improved version of theirs.

Trend IndicatorThis indicator has different features:
1. Ichimoku = this indicator can plot Ichimoku calculated both in the common formula and with the volume average, you can choose the calculator method for each line.
2. Channel and Bands = this mode allows the user to choose from channel and band, "channel" shows the Keltner channel, and "band" shows the Bollinger bands. Both the indicators are calculated including the volume in the formula of the average midpoint.
3. Color candle = this function allows the user to see two different colors of candles on the chart, the positive color occurs when both the long-term average and the short team average of price calculated using the volume is above the two averages calculated without the volume. This function is great to analyze the volume pressure, useful to identify trend continuation and exhaustion.
4. Extreme reversal zones = this is a version of the Keltner channels calculated over a high number of candles and with high deviation, to identify the potential zones of reversal.
Note that in the "Ichimoku" indicator, the backline is the T.R.A.M.A. indicator, created and published open source by Lux Algo, which I thank for the script.
