OPEN-SOURCE SCRIPT
已更新 [blackcat] L1 Vitali Apirine MAB
Level 1
Background
Vitali Apirine’s articles in the July & August issues on 2021, “Moving Average Bands”
Function
In “Moving Average Bands” (part 1, July 2021 issue) and “Moving Average Band Width” (part 2, August 2021 issue), author Vitali Apirine explains how moving average bands (MAB) can be used as a trend-following indicator by displaying the movement of a shorter-term moving average in relation to the movement of a longer-term moving average. The distance between the bands will widen as volatility increases and will narrow as volatility decreases.
Remarks
This is a Level 1 free and open source indicator.
Feedbacks are appreciated.
發行說明
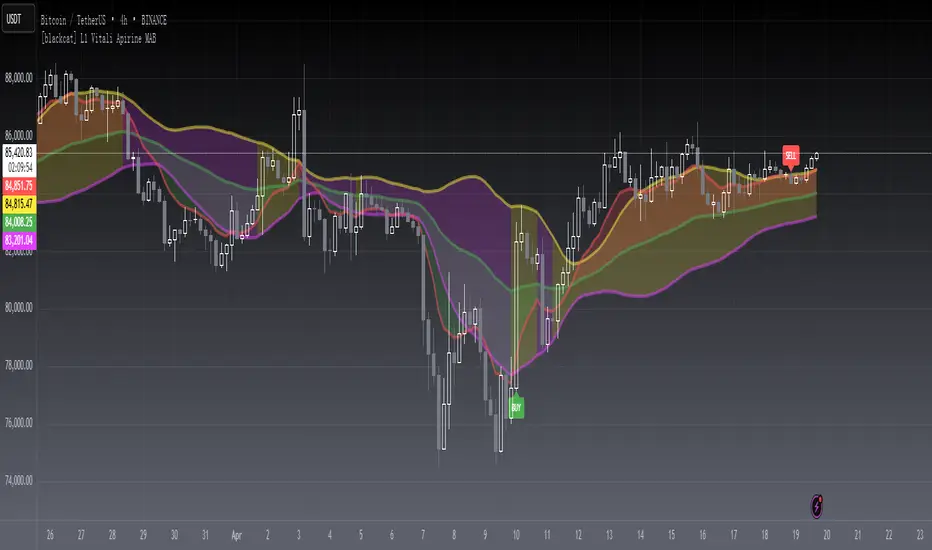
OVERVIEWThe [blackcat] L1 Vitali Apirine MAB indicator implements Vitali Apirine's Moving Average Bands (MAB) strategy, providing traders with a visual representation of price volatility and trend direction. This script calculates upper and lower bands around a mid-line Exponential Moving Average (EMA), generating buy and sell signals based on price interactions with these bands. It also includes alerts for various crossover events, enhancing decision-making processes 📊✅.
FEATURES
Calculates and plots Moving Average Bands:
Upper Band
Lower Band
Mid Line (Short-term EMA)
Long-term EMA
Visualizes band width and trend direction using colored fills between lines.
Generates buy and sell signals based on price crossovers with the bands 🚀📉
Adds visual labels for easy identification of trade signals:
"BUY" labeled in green when price crosses above the lower band.
"SELL" labeled in red when price crosses below the upper band.
Provides alert conditions for multiple crossover events 🔔
HOW TO USE
Add the indicator to your TradingView chart by selecting it from the indicators list.
Observe the plotted bands and EMAs for trends and volatility insights.
Monitor the buy ('BUY') and sell ('SELL') labels on the chart for potential trade opportunities.
Set up alerts based on the generated signals to receive notifications when conditions are met 📲.
Combine this indicator with other tools for confirmation before making trading decisions.
INPUT PARAMETERS
Short Period: Define the period for the short-term EMA (default is 50).
Long Period: Define the period for the long-term EMA (default is 10).
Multiplier: Adjust the bandwidth multiplier (default is 1.0).
LIMITATIONS
The indicator may generate false signals in highly volatile or ranging markets 🌪️.
Users should always confirm signals with other forms of analysis.
Optimal settings might vary depending on the asset and timeframe.
NOTES
Ensure that you have sufficient historical data available for accurate calculations.
Test the indicator thoroughly on demo accounts before applying it to live trading 🔍.
Experiment with different input parameters to find the best fit for your trading strategy.
開源腳本
秉持TradingView一貫精神,這個腳本的創作者將其設為開源,以便交易者檢視並驗證其功能。向作者致敬!您可以免費使用此腳本,但請注意,重新發佈代碼需遵守我們的社群規範。
Avoid losing contact!Don't miss out! The first and most important thing to do is to join my Discord chat now! Click here to start your adventure: discord.com/invite/ZTGpQJq 防止失联,请立即行动,加入本猫聊天群: discord.com/invite/ZTGpQJq
免責聲明
這些資訊和出版物並非旨在提供,也不構成TradingView提供或認可的任何形式的財務、投資、交易或其他類型的建議或推薦。請閱讀使用條款以了解更多資訊。