OPEN-SOURCE SCRIPT
Lowry Upside % Volume
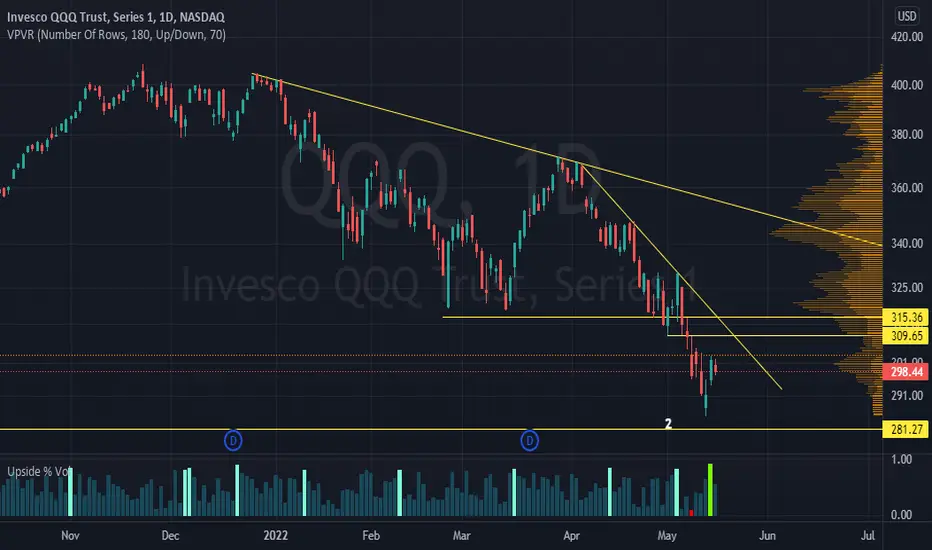
This script takes the total NYSE volume for the day and determines what percentage of that volume is Upside Volume (or buying volume).
What's different in this script compared to others is that the 3 most essential values determined by Paul F. Desmond's Dow Award-winning paper for Lowry's Reports are color coded:
1) 90% Upside Volume Day
2) 80% Upside Volume Day
3) 90% Downside Volume Day
According to Paul's award-winning research, these precise criteria are objective definitions of panic selling and panic buying and are generally near major market tops and bottoms.
His Dow Award-winning paper on the topic can be explored and scrutinized in more detail here:
docs.cmtassociation.org/docs/2002DowAwardb.pdf
開源腳本
秉持TradingView一貫精神,這個腳本的創作者將其設為開源,以便交易者檢視並驗證其功能。向作者致敬!您可以免費使用此腳本,但請注意,重新發佈代碼需遵守我們的社群規範。
免責聲明
這些資訊和出版物並非旨在提供,也不構成TradingView提供或認可的任何形式的財務、投資、交易或其他類型的建議或推薦。請閱讀使用條款以了解更多資訊。
開源腳本
秉持TradingView一貫精神,這個腳本的創作者將其設為開源,以便交易者檢視並驗證其功能。向作者致敬!您可以免費使用此腳本,但請注意,重新發佈代碼需遵守我們的社群規範。
免責聲明
這些資訊和出版物並非旨在提供,也不構成TradingView提供或認可的任何形式的財務、投資、交易或其他類型的建議或推薦。請閱讀使用條款以了解更多資訊。