OPEN-SOURCE SCRIPT
已更新 Stock Cumulative Percent Change
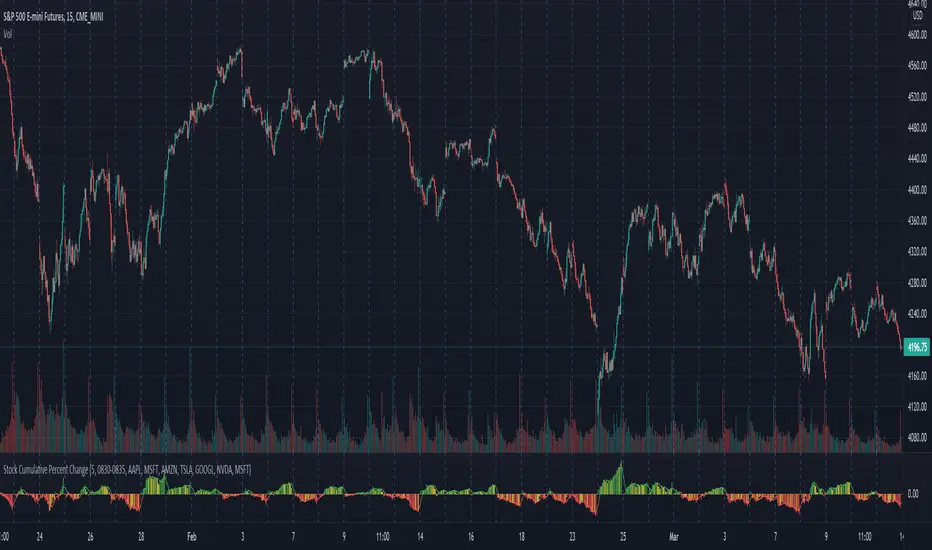
This script shows the cumulative rate of change of the top 7 stocks held in the S&P 500. These stocks are all market leaders and being aware of their performance can help one to stay on the right side of the overall market.
The percent change from bar to bar is calculated. The percent change of all 7 is combined in an average of those pct changes. Finally starting the day at 0, the pct change for each bar is accumulated throughout the day.
The timeframe can be modified in the options, as well as the list of stocks that are considered.
The original idea came from @TicTocTick and was then coded in Pine by @connorwinemil, credit where credit is due. I modified to make it cumulative and allowed intra day time frames.
發行說明
Adjusted to allow all timeframes and default to the chart's timeframe.發行說明
Expose the windows where the change is suppressed. Set values to standard market open and close.開源腳本
秉持TradingView一貫精神,這個腳本的創作者將其設為開源,以便交易者檢視並驗證其功能。向作者致敬!您可以免費使用此腳本,但請注意,重新發佈代碼需遵守我們的社群規範。
免責聲明
這些資訊和出版物並非旨在提供,也不構成TradingView提供或認可的任何形式的財務、投資、交易或其他類型的建議或推薦。請閱讀使用條款以了解更多資訊。
開源腳本
秉持TradingView一貫精神,這個腳本的創作者將其設為開源,以便交易者檢視並驗證其功能。向作者致敬!您可以免費使用此腳本,但請注意,重新發佈代碼需遵守我們的社群規範。
免責聲明
這些資訊和出版物並非旨在提供,也不構成TradingView提供或認可的任何形式的財務、投資、交易或其他類型的建議或推薦。請閱讀使用條款以了解更多資訊。