OPEN-SOURCE SCRIPT
Wave Channel 3D
Wave Channel 3D
Built by Ricardo idea from JR & Aloakdutt from indieTrades Jan. 2010
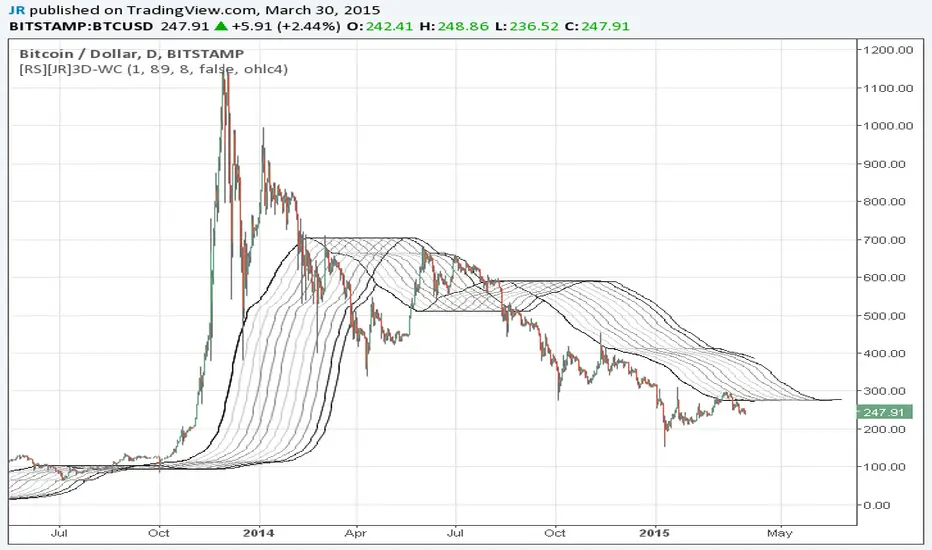
This indicator is very easy to build. We utilize Moving Averages with a set multiplier and an offset. Specially we try to use Fibonacci sequence series numbers (1, 2, 3, 5, 8, 13, 21, 34, 55, 89, 144...) as time space and multiplier (default 89, 8). Also included is Donchian Channel to locate strong trends and possible future support - resistance.
Examples of support/resistance on chart.

Dominant Price Trends

Future Support Resistance

Comparing Fibonacci Series Time Space - Multiplier

When Comparing make note of confluence support/resistance showing up with Fibonacci Series
Example uses DC

When Comparing make note of confluence support/resistance showing up with Fibonacci Series
Example without DC / Smooth MA

Built by Ricardo idea from JR & Aloakdutt from indieTrades Jan. 2010
This indicator is very easy to build. We utilize Moving Averages with a set multiplier and an offset. Specially we try to use Fibonacci sequence series numbers (1, 2, 3, 5, 8, 13, 21, 34, 55, 89, 144...) as time space and multiplier (default 89, 8). Also included is Donchian Channel to locate strong trends and possible future support - resistance.
Examples of support/resistance on chart.
Dominant Price Trends
Future Support Resistance
Comparing Fibonacci Series Time Space - Multiplier
When Comparing make note of confluence support/resistance showing up with Fibonacci Series
Example uses DC
When Comparing make note of confluence support/resistance showing up with Fibonacci Series
Example without DC / Smooth MA
開源腳本
本著TradingView的真正精神,此腳本的創建者將其開源,以便交易者可以查看和驗證其功能。向作者致敬!雖然您可以免費使用它,但請記住,重新發佈程式碼必須遵守我們的網站規則。
免責聲明
這些資訊和出版物並不意味著也不構成TradingView提供或認可的金融、投資、交易或其他類型的意見或建議。請在使用條款閱讀更多資訊。
開源腳本
本著TradingView的真正精神,此腳本的創建者將其開源,以便交易者可以查看和驗證其功能。向作者致敬!雖然您可以免費使用它,但請記住,重新發佈程式碼必須遵守我們的網站規則。
免責聲明
這些資訊和出版物並不意味著也不構成TradingView提供或認可的金融、投資、交易或其他類型的意見或建議。請在使用條款閱讀更多資訊。