OPEN-SOURCE SCRIPT
Dynamic Trailing Stop with Trend Change
Key features of this script:
Trend Identification: Uses previous day's high/low breaks to identify trend changes.
Uptrend starts when price closes above the previous day's high.
Downtrend starts when price closes below the previous day's low.
Dynamic Trailing Stop:
In an uptrend, the stop is set to the previous day's low and trails higher.
In a downtrend, the stop is set to the previous day's high and trails lower.
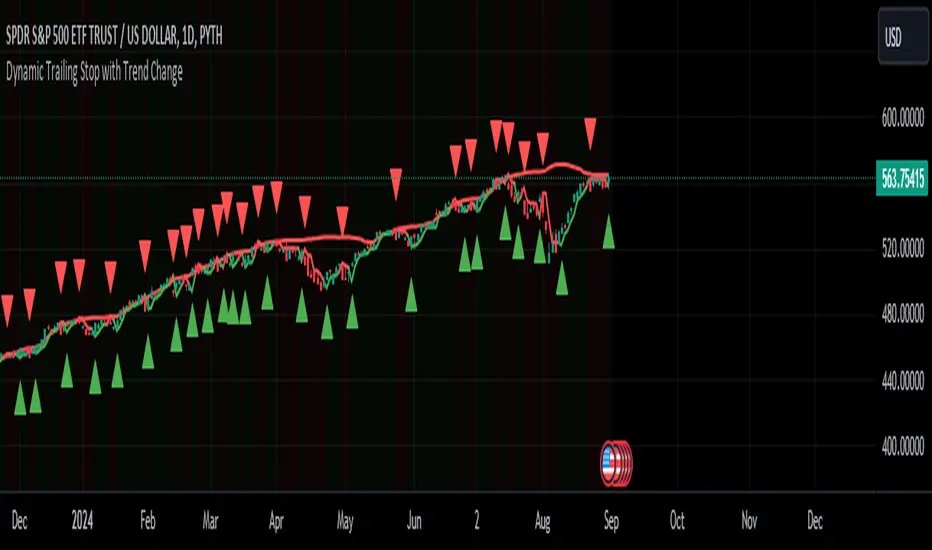
Visual Indicators:
Green triangle for uptrend start, red triangle for downtrend start.
Green/red line for the trailing stop.
Background color changes to light green in uptrends, light red in downtrends.
Alerts:
Trend change alerts when a new trend is identified.
Stop hit alerts when price crosses the trailing stop, suggesting a potential exit.
This implementation allows you to:
Identify trend changes based on previous day's high/low breaks.
Trail your stop loss dynamically as the trend progresses.
Get visual and alert-based signals for trend changes and potential exit points.
For swing trading, you could:
Enter long when an uptrend starts (green triangle).
Set your initial stop loss to the trailing stop (green line).
Exit if the price closes below the trailing stop or a downtrend starts (red triangle).
(Reverse for short trades)
Remember, while this strategy can be effective, it's important to combine it with other forms of analysis and proper risk management. The effectiveness can vary depending on the volatility of the asset and overall market conditions. Always test thoroughly before using in live trading.
Trend Identification: Uses previous day's high/low breaks to identify trend changes.
Uptrend starts when price closes above the previous day's high.
Downtrend starts when price closes below the previous day's low.
Dynamic Trailing Stop:
In an uptrend, the stop is set to the previous day's low and trails higher.
In a downtrend, the stop is set to the previous day's high and trails lower.
Visual Indicators:
Green triangle for uptrend start, red triangle for downtrend start.
Green/red line for the trailing stop.
Background color changes to light green in uptrends, light red in downtrends.
Alerts:
Trend change alerts when a new trend is identified.
Stop hit alerts when price crosses the trailing stop, suggesting a potential exit.
This implementation allows you to:
Identify trend changes based on previous day's high/low breaks.
Trail your stop loss dynamically as the trend progresses.
Get visual and alert-based signals for trend changes and potential exit points.
For swing trading, you could:
Enter long when an uptrend starts (green triangle).
Set your initial stop loss to the trailing stop (green line).
Exit if the price closes below the trailing stop or a downtrend starts (red triangle).
(Reverse for short trades)
Remember, while this strategy can be effective, it's important to combine it with other forms of analysis and proper risk management. The effectiveness can vary depending on the volatility of the asset and overall market conditions. Always test thoroughly before using in live trading.
開源腳本
秉持TradingView一貫精神,這個腳本的創作者將其設為開源,以便交易者檢視並驗證其功能。向作者致敬!您可以免費使用此腳本,但請注意,重新發佈代碼需遵守我們的社群規範。
免責聲明
這些資訊和出版物並非旨在提供,也不構成TradingView提供或認可的任何形式的財務、投資、交易或其他類型的建議或推薦。請閱讀使用條款以了解更多資訊。
免責聲明
這些資訊和出版物並非旨在提供,也不構成TradingView提供或認可的任何形式的財務、投資、交易或其他類型的建議或推薦。請閱讀使用條款以了解更多資訊。