OPEN-SOURCE SCRIPT
Simplified STH-MVRV + Z-Score
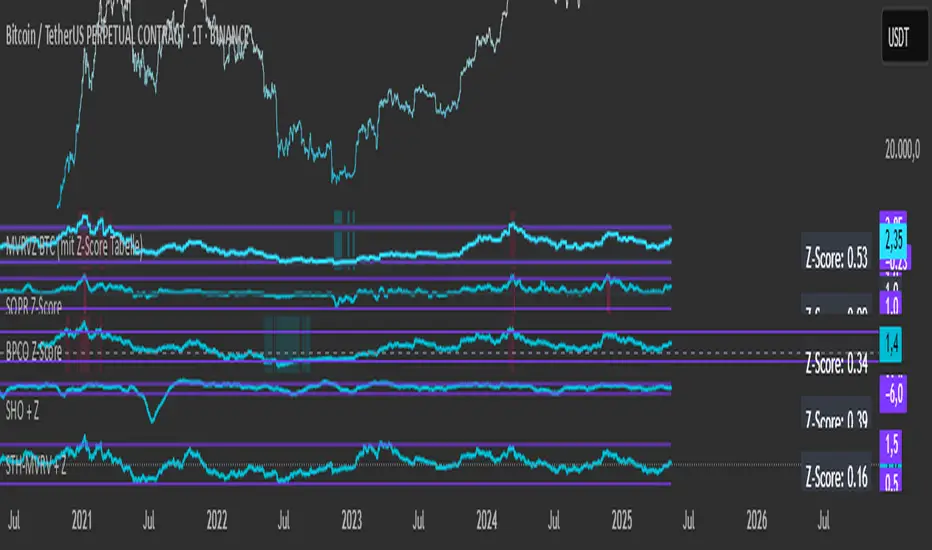
Simplified Short Term Holder MVRV (STH-MVRV) + Z-Score Indicator
Description:
This indicator visualizes the Short Term Holder Market Value to Realized Value ratio (STH-MVRV) and its normalized Z-Score, providing insight into Bitcoin’s market cycle phases and potential overbought or oversold conditions.
How it works:
The STH-MVRV ratio compares the market value of coins held by short-term holders to their realized value, helping to identify periods of profit-taking or accumulation by these holders.
The indicator calculates three versions:
STH-MVRV (MVRV): Ratio of current MVRV to its 155-day SMA.
STH-MVRV (Price): Ratio of BTC price to its 155-day SMA.
STH-MVRV (AVG): Average of the above two ratios.
You can select which ratio to display via the input dropdown.
Threshold Lines:
Adjustable upper and lower threshold lines mark significant levels where market sentiment might shift.
The indicator also plots a baseline at 1.0 as a reference.
Z-Score Explanation:
The Z-Score is a normalized value scaled between -3 and +3, calculated relative to the chosen threshold levels.
When the ratio hits the upper threshold, the Z-Score approaches +2, indicating potential overbought conditions.
Conversely, reaching the lower threshold corresponds to a Z-Score near -2, signaling potential oversold conditions.
This Z-Score is shown in a clear table in the top right corner of the chart for easy monitoring.
Data Sources:
MVRV data is fetched from the BTC_MVRV dataset.
Price data is sourced from the BTC/USD index.
Usage:
Use this indicator to assess short-term holder market behavior and to help identify buying or selling opportunities based on extremes indicated by the Z-Score.
Combining this tool with other analysis can improve timing decisions in Bitcoin trading.
開源腳本
秉持TradingView一貫精神,這個腳本的創作者將其設為開源,以便交易者檢視並驗證其功能。向作者致敬!您可以免費使用此腳本,但請注意,重新發佈代碼需遵守我們的社群規範。
免責聲明
這些資訊和出版物並非旨在提供,也不構成TradingView提供或認可的任何形式的財務、投資、交易或其他類型的建議或推薦。請閱讀使用條款以了解更多資訊。
開源腳本
秉持TradingView一貫精神,這個腳本的創作者將其設為開源,以便交易者檢視並驗證其功能。向作者致敬!您可以免費使用此腳本,但請注意,重新發佈代碼需遵守我們的社群規範。
免責聲明
這些資訊和出版物並非旨在提供,也不構成TradingView提供或認可的任何形式的財務、投資、交易或其他類型的建議或推薦。請閱讀使用條款以了解更多資訊。