OPEN-SOURCE SCRIPT
已更新 ATR SL Visualization (on chart)
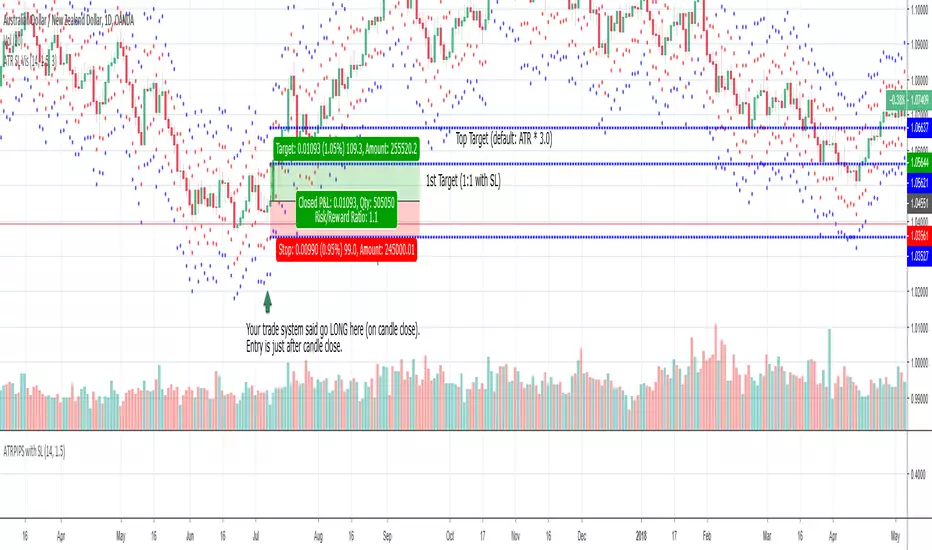
This indicator plots 2 sets of dots (and lines) based on your chosen ATR multiplier (Average True Range).
Generally, when trading on the daily timeframe a good rule of thumb is to use the ATR * 1.5 (the default setting of this indicator).
I created this indicator to quickly test other indicators but I also find it helpful in live trading.
How to use this indicator:
Your trade system provides an entry signal. The red dot (can be connected line in options) would be used as the stop loss for either a long or short.
Then the dot on the other side would be your first 1:1 target.
The blue line is the same ATR multiplier as a target (default but can be modified).
Using an additional tool like the horizontal ray can be helpful to see the exact location the SL might be hit or where the target might hit.
When drawing your ray ensure you’re using the right entry candle.
For instance, in a long scenario you would typically be entering a trade after your signal candle closes. So draw the ray at the point in price on the next candle for both stop loss and target.
Also use these dots (lines) as guides provides an easy way to plot SL and targets if you want to use the Long or Short tool.
For my trade systems I don’t use price targets (I exit when structure or indicators reveal to exit) but I do find it helpful to graph when testing. When something moves in my favor either the ATR or the ATR * 1.5 I take profit and typically move up my stop loss to break even or trailing.
The other strategy that could be possible but have not tested is as long as the SL is making a new high moving up a hard stop to the ATR SL each day the trade goes in your favor.
This should be obvious but if you want to use just the true ATR edit the multiplier to be 1.0
發行說明
This includes options to turn off and on the lines開源腳本
秉持TradingView一貫精神,這個腳本的創作者將其設為開源,以便交易者檢視並驗證其功能。向作者致敬!您可以免費使用此腳本,但請注意,重新發佈代碼需遵守我們的社群規範。
免責聲明
這些資訊和出版物並非旨在提供,也不構成TradingView提供或認可的任何形式的財務、投資、交易或其他類型的建議或推薦。請閱讀使用條款以了解更多資訊。
開源腳本
秉持TradingView一貫精神,這個腳本的創作者將其設為開源,以便交易者檢視並驗證其功能。向作者致敬!您可以免費使用此腳本,但請注意,重新發佈代碼需遵守我們的社群規範。
免責聲明
這些資訊和出版物並非旨在提供,也不構成TradingView提供或認可的任何形式的財務、投資、交易或其他類型的建議或推薦。請閱讀使用條款以了解更多資訊。