INVITE-ONLY SCRIPT
已更新 MTF BB%+ [Overlay] [Intromoto]
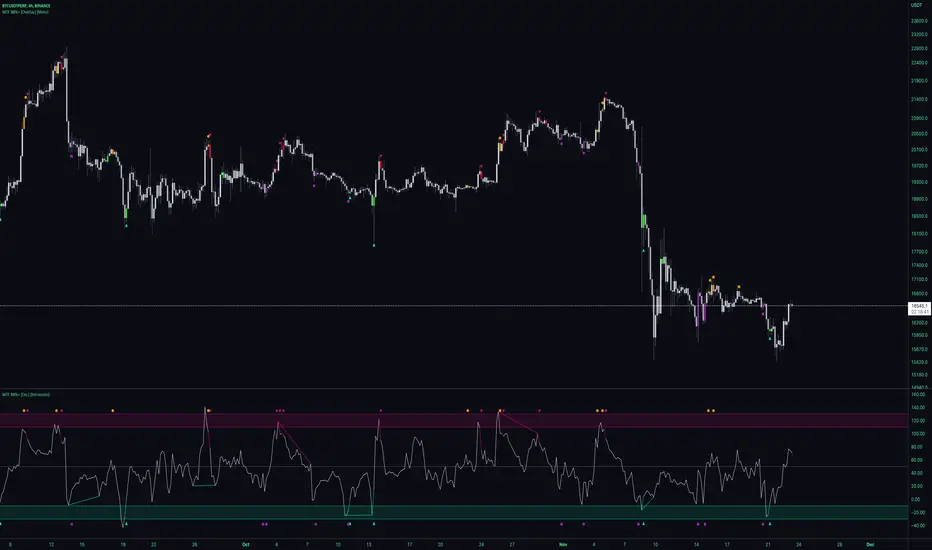
This indicator is based around BB%, essentially showing where deviations are within price over time. This is the overlay version, better to see the precise candle signals.
Plotshapes are printed when exiting extremes of the deviations, back towards the mean.
Arrows indicate an increased likelihood of price reverting direction. Red arrow =bearish, green arrow = bullish. Dots below candles = bullish, above candles = bearish.
Dots on the top and bottom of the candles show a sub level of reversion that would be perhaps less extreme than when price reenters the norm from the normal standard deviation.
Users can also change the timeframe of the indicator for high time frame signals.
Barcolors for plotshapes included.
DM for access
Thanks
發行說明
Added user inputs for plotshape variables發行說明
Added ability to change MA type發行說明
Removed oscillator plots. Prevented overlapping signals發行說明
Added alerts發行說明
Removed extraneous data points from oscillator version. Updated to v5.發行說明
Added Alerts for Purple / Orange plotshapesDM for access.
Follow on Twitter for updates.
One time fee, no subscription
twitter.com/IntroMoto
Follow on Twitter for updates.
One time fee, no subscription
twitter.com/IntroMoto
免責聲明
這些資訊和出版物並不意味著也不構成TradingView提供或認可的金融、投資、交易或其他類型的意見或建議。請在使用條款閱讀更多資訊。
DM for access.
Follow on Twitter for updates.
One time fee, no subscription
twitter.com/IntroMoto
Follow on Twitter for updates.
One time fee, no subscription
twitter.com/IntroMoto
免責聲明
這些資訊和出版物並不意味著也不構成TradingView提供或認可的金融、投資、交易或其他類型的意見或建議。請在使用條款閱讀更多資訊。