OPEN-SOURCE SCRIPT
已更新 Multi ZZ - Support/Resistence
Experimental and probably can be improved further.
Method of deriving support/resistence is as follows:
And that's all we got the full list of support and resistence points.
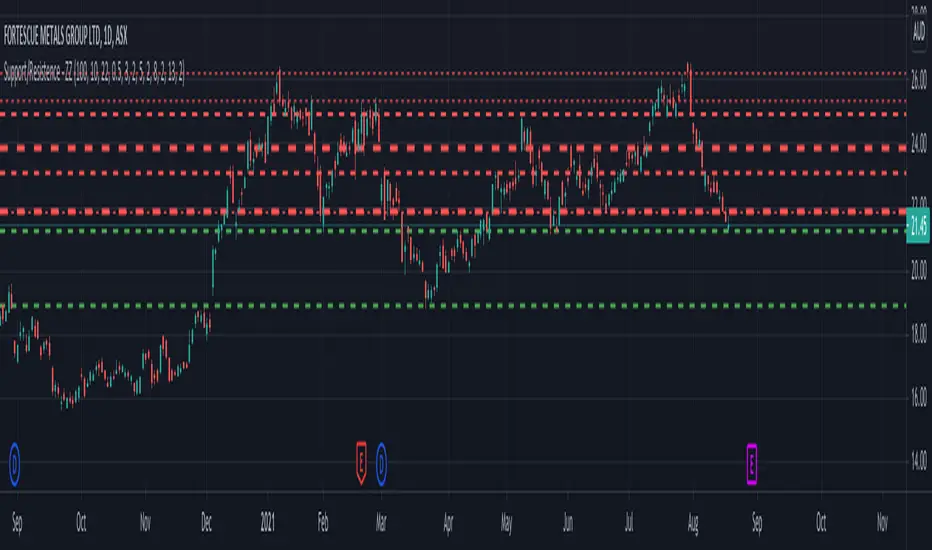
Now, to filter insignificant pivots, chose only those points which has been merged by more than Min Pivots input. Width of the support/resistence lines also will be thicker for the pivots which has more count. Hence thicker line imply strong support and resistence whereas the thinner ones are minor ones.
Method of deriving support/resistence is as follows:
- Calculate Zigzags and start pushing them to SR array as and when they form
- If any of the existing item is within the small distance - merge them. ATR is used to find if the prices are close by.
- Whenever we merge two pivots, strength of support keeps increasing. This means, price has bounced off this point more time. Hence, keep track of number of pivots merged together.
- Keep removing old pivots which are far away based on Loopback input
And that's all we got the full list of support and resistence points.
Now, to filter insignificant pivots, chose only those points which has been merged by more than Min Pivots input. Width of the support/resistence lines also will be thicker for the pivots which has more count. Hence thicker line imply strong support and resistence whereas the thinner ones are minor ones.
發行說明
Convert to Pine 5開源腳本
秉持TradingView一貫精神,這個腳本的創作者將其設為開源,以便交易者檢視並驗證其功能。向作者致敬!您可以免費使用此腳本,但請注意,重新發佈代碼需遵守我們的社群規範。
Trial - trendoscope.io/trial
Subscribe - trendoscope.io/pricing
Blog - docs.trendoscope.io
Subscribe - trendoscope.io/pricing
Blog - docs.trendoscope.io
免責聲明
這些資訊和出版物並非旨在提供,也不構成TradingView提供或認可的任何形式的財務、投資、交易或其他類型的建議或推薦。請閱讀使用條款以了解更多資訊。
開源腳本
秉持TradingView一貫精神,這個腳本的創作者將其設為開源,以便交易者檢視並驗證其功能。向作者致敬!您可以免費使用此腳本,但請注意,重新發佈代碼需遵守我們的社群規範。
Trial - trendoscope.io/trial
Subscribe - trendoscope.io/pricing
Blog - docs.trendoscope.io
Subscribe - trendoscope.io/pricing
Blog - docs.trendoscope.io
免責聲明
這些資訊和出版物並非旨在提供,也不構成TradingView提供或認可的任何形式的財務、投資、交易或其他類型的建議或推薦。請閱讀使用條款以了解更多資訊。