OPEN-SOURCE SCRIPT
ADA Gravity Oscillator
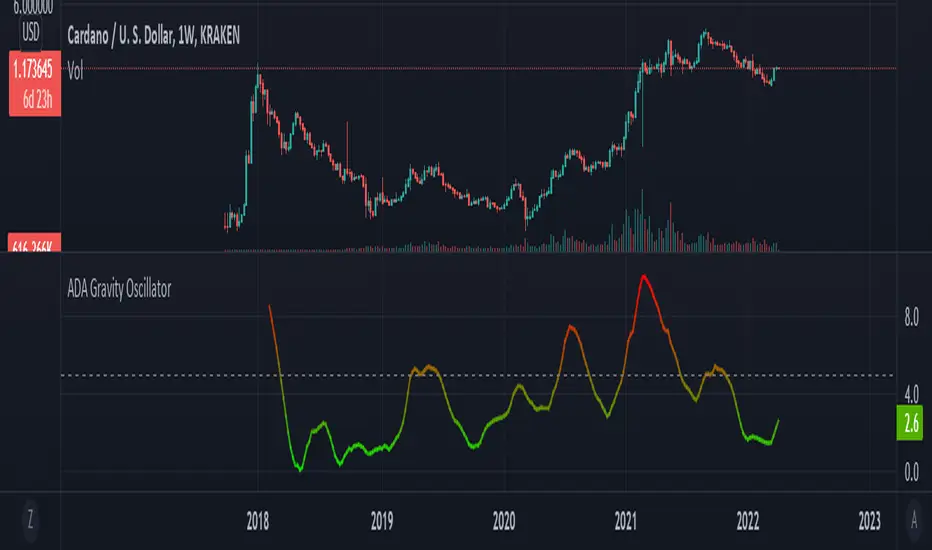
This indicator is a deviation of a Center of Gravity Oscillator corrected for the diminishing returns of Cardano (ADA).
I've set up this indicator for it to be used on the weekly timeframe . The indicator oscillates between 0 and 10, where 0 indicates oversold conditions and 10 indicates overbought conditions.
The indicator plots in any ADAUSD chart.
It paints in all time frames, but Weekly time frame is the correct one to interpret the 'official' read of it.
開源腳本
秉持TradingView一貫精神,這個腳本的創作者將其設為開源,以便交易者檢視並驗證其功能。向作者致敬!您可以免費使用此腳本,但請注意,重新發佈代碼需遵守我們的社群規範。
免責聲明
這些資訊和出版物並非旨在提供,也不構成TradingView提供或認可的任何形式的財務、投資、交易或其他類型的建議或推薦。請閱讀使用條款以了解更多資訊。
開源腳本
秉持TradingView一貫精神,這個腳本的創作者將其設為開源,以便交易者檢視並驗證其功能。向作者致敬!您可以免費使用此腳本,但請注意,重新發佈代碼需遵守我們的社群規範。
免責聲明
這些資訊和出版物並非旨在提供,也不構成TradingView提供或認可的任何形式的財務、投資、交易或其他類型的建議或推薦。請閱讀使用條款以了解更多資訊。