OPEN-SOURCE SCRIPT
Custom Group Financials [Technimentals]
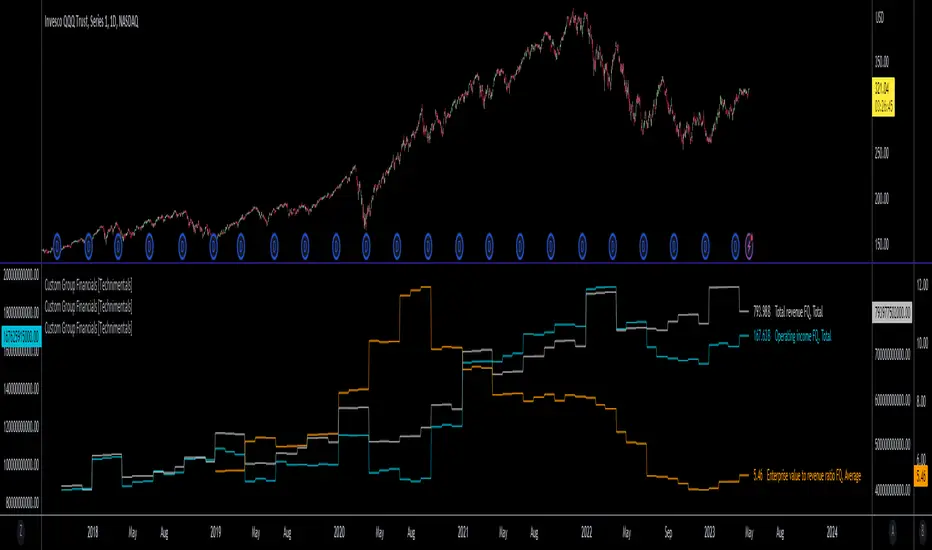
This script allows the user to build custom groups and combine the same financial data from 40 different symbols simultaneously and plot it data as a total or as an average.
By default, the top 40 symbols in the QQQ are used. Between them they account for the majority of the index. This is a good workaround for the lack of ETF financial data in TradingView.
This functions much like any other financial indicator. You choose the financial data and period:
FY = Financial Year
FQ = Financial Quarter
TTM = Trailing Twelve Months
Bare in mind that some data only exists in FY data.
Thanks to LucF for writing most of this code!
Enjoy!
開源腳本
秉持TradingView一貫精神,這個腳本的創作者將其設為開源,以便交易者檢視並驗證其功能。向作者致敬!您可以免費使用此腳本,但請注意,重新發佈代碼需遵守我們的社群規範。
免責聲明
這些資訊和出版物並非旨在提供,也不構成TradingView提供或認可的任何形式的財務、投資、交易或其他類型的建議或推薦。請閱讀使用條款以了解更多資訊。
開源腳本
秉持TradingView一貫精神,這個腳本的創作者將其設為開源,以便交易者檢視並驗證其功能。向作者致敬!您可以免費使用此腳本,但請注意,重新發佈代碼需遵守我們的社群規範。
免責聲明
這些資訊和出版物並非旨在提供,也不構成TradingView提供或認可的任何形式的財務、投資、交易或其他類型的建議或推薦。請閱讀使用條款以了解更多資訊。