OPEN-SOURCE SCRIPT
Trend with Mathematical Approach GOLD [AstroHub]
Welcome to the Trend with Mathematical Approach! 🚀
This tool uses a unique mathematical approach to help you spot potential trend beginnings in the market.
By analyzing the derivative of closing prices and applying a specialized moving average, SmartTrend identifies
key points where a new trend might be starting.
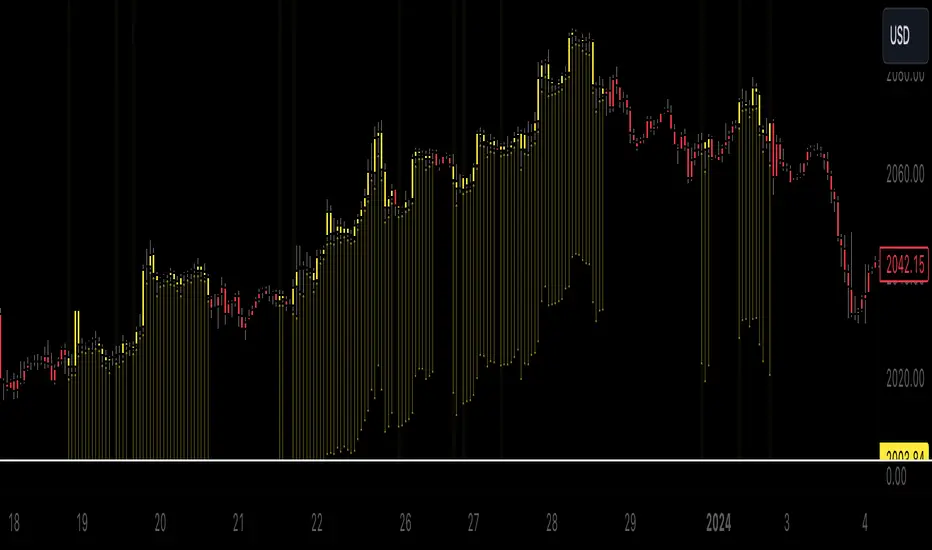
🟢 Green arrows show potential BUY opportunities when a new uptrend begins.
🔴 Red arrows indicate potential SELL opportunities when a new downtrend starts.
Additionally, the indicator provides easy-to-read colored backgrounds to highlight potential trend zones.
Green means a potential uptrend, and red suggests a potential downtrend.
To make it even more user-friendly, SmartTrend adds clear labels for BUY and SELL signals directly on the chart,
making it easy for you to spot opportunities at a glance.
💡 Pro Tip: Use the built-in alerts to get notified when SmartTrend identifies a potential trade opportunity.
Enjoy using SmartTrend and happy trading! 📈💰
開源腳本
秉持TradingView一貫精神,這個腳本的創作者將其設為開源,以便交易者檢視並驗證其功能。向作者致敬!您可以免費使用此腳本,但請注意,重新發佈代碼需遵守我們的社群規範。
免責聲明
這些資訊和出版物並非旨在提供,也不構成TradingView提供或認可的任何形式的財務、投資、交易或其他類型的建議或推薦。請閱讀使用條款以了解更多資訊。
免責聲明
這些資訊和出版物並非旨在提供,也不構成TradingView提供或認可的任何形式的財務、投資、交易或其他類型的建議或推薦。請閱讀使用條款以了解更多資訊。