OPEN-SOURCE SCRIPT
[QG] Dynamic Zones Value Chart
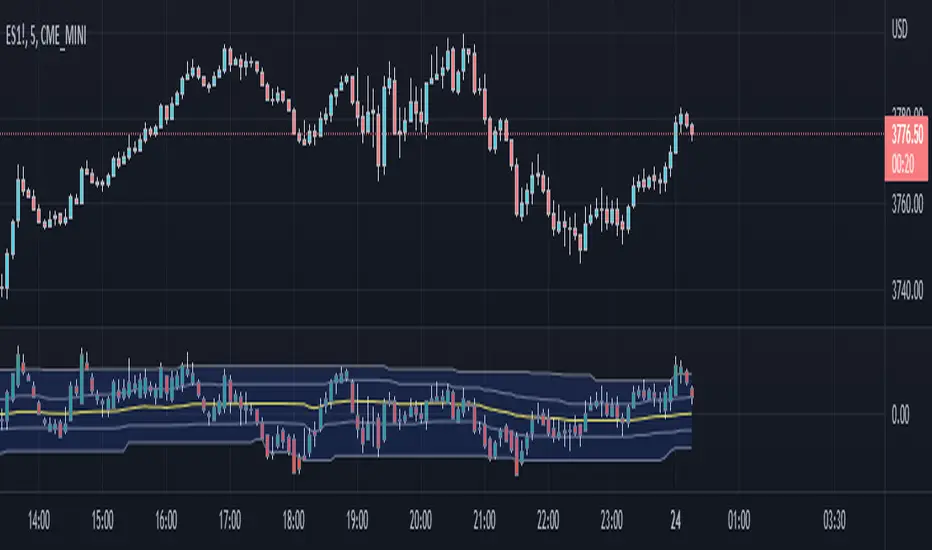
The classic value charts indicator has fixed overbought and oversold levels at 8 and 10 levels and the idea of adding dynamic zones around them instead of fixed levels is appealing.
During the strong trending movements, the overbought and oversold levels also dynamically move up or down.
I have used the dynamic zones code by @allanster.
The idea of using dynamic zones on value charts comes from a similar indicator available in mql4.
During the strong trending movements, the overbought and oversold levels also dynamically move up or down.
I have used the dynamic zones code by @allanster.
The idea of using dynamic zones on value charts comes from a similar indicator available in mql4.
開源腳本
秉持TradingView一貫精神,這個腳本的創作者將其設為開源,以便交易者檢視並驗證其功能。向作者致敬!您可以免費使用此腳本,但請注意,重新發佈代碼需遵守我們的社群規範。
免責聲明
這些資訊和出版物並非旨在提供,也不構成TradingView提供或認可的任何形式的財務、投資、交易或其他類型的建議或推薦。請閱讀使用條款以了解更多資訊。
免責聲明
這些資訊和出版物並非旨在提供,也不構成TradingView提供或認可的任何形式的財務、投資、交易或其他類型的建議或推薦。請閱讀使用條款以了解更多資訊。