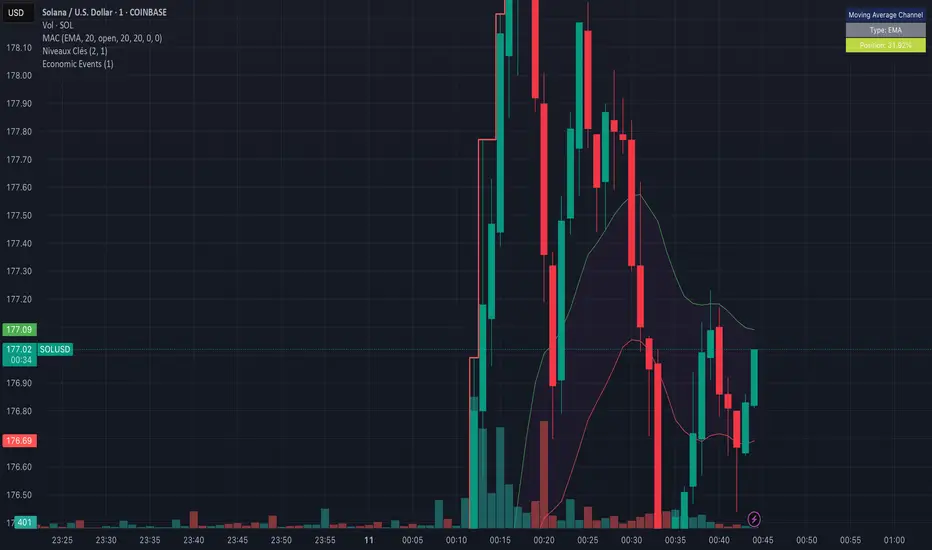
OPEN-SOURCE SCRIPT
Economic Event Dates

This TradingView indicator ("Economic Event Dates") plots significant economic event dates directly on your chart, helping you stay informed about potential market-moving announcements. It includes pre-configured dates for:
* **FOMC Meetings:** Key policy meetings of the Federal Open Market Committee.
* **CPI Releases:** Consumer Price Index data releases, a key measure of inflation.
* **Bitcoin Halvings:** Programmatic reductions in Bitcoin's new supply issuance.
**Features:**
* **Customizable Dates:** Easily input and manage dates for FOMC, CPI, and Halving events for current and future years (2025, 2026, and beyond for Halvings).
* **Visual Cues:** Displays vertical lines on the chart at the precise time of each event.
* **Event Labels:** Shows clear labels (e.g., "FOMC", "CPI", "Halving") for each event line.
* **Color Coding:** Distinct colors for FOMC (blue), CPI (orange), and Halving (purple) events for quick identification.
* **Future Events Focus:** Option to display only upcoming events relative to the current real time.
* **Morning Alerts:** (Optional) Triggers an alert on the morning of a scheduled event, providing a timely reminder.
* **Customizable Appearance:** Adjust line width and toggle label visibility.
**How to Use:**
1. Add the indicator to your TradingView chart.
2. Review and update the input dates for FOMC, CPI, and Halving events in the indicator settings. The script includes placeholders and notes for future dates that may require verification from official sources (e.g., federalreserve.gov, bls.gov).
3. Customize colors, line width, label visibility, and alert preferences as needed.
4. Observe the vertical lines on your chart indicating upcoming economic events.
This tool is designed for traders and investors who want to incorporate awareness of major economic events into their market analysis. Remember to verify future event dates as they are officially announced.
Created by YouNesta
開源腳本
秉持TradingView一貫精神,這個腳本的創作者將其設為開源,以便交易者檢視並驗證其功能。向作者致敬!您可以免費使用此腳本,但請注意,重新發佈代碼需遵守我們的社群規範。
免責聲明
這些資訊和出版物並非旨在提供,也不構成TradingView提供或認可的任何形式的財務、投資、交易或其他類型的建議或推薦。請閱讀使用條款以了解更多資訊。
開源腳本
秉持TradingView一貫精神,這個腳本的創作者將其設為開源,以便交易者檢視並驗證其功能。向作者致敬!您可以免費使用此腳本,但請注意,重新發佈代碼需遵守我們的社群規範。
免責聲明
這些資訊和出版物並非旨在提供,也不構成TradingView提供或認可的任何形式的財務、投資、交易或其他類型的建議或推薦。請閱讀使用條款以了解更多資訊。