OPEN-SOURCE SCRIPT
Eurobond Curve

ABOUT
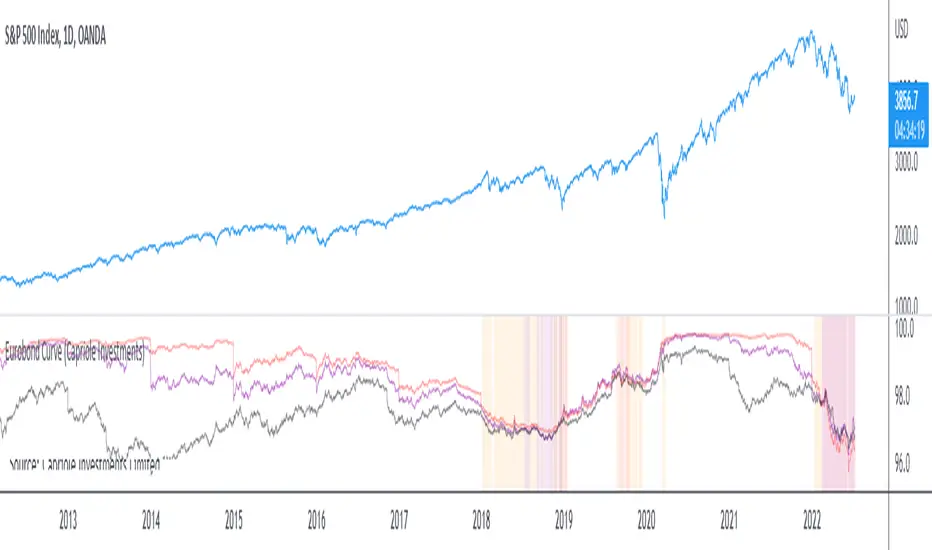
Dynamically plots 3 no. forward EUROBOND curves. When the curves converge (or worse crossover) there is higher risk of financial uncertainty and potential market correction.
The Eurobond Curves work in a similar way to treasury "yield curve inversion"; except the EUROBOND curves can signal much earlier than Treasuries therefore providing a leading indicator.
The indicator looks the the "near" (next year EUROBOND), "mid" (EUROBOND 2 years out) and "far" (EUROBOND 5 years out) to assess for crossovers.
When the "near" and "mid" curves crossover the "far" curve, concerning economic conditions are developing and it may be a good idea to reduce risk exposure to markets.
LIMITATIONS
The EUROBOND curve crossover events are rare, and this indicator uses data back to 2005 (using approximately 25 TradingView security functions). Given there are relatively few crossover events, the reliability of this indicator should be considered low. Nonetheless, there is decent alignment with treasury yield curve inversions in the 20 year period assessed. Given treasury yield curve inversions have predicted every recession for the last 70 years, we still think the EUROBOND Curves are a useful datapoint to monitor into the future and provide confluence to other risk management strategies.
開源腳本
本著TradingView的真正精神,此腳本的創建者將其開源,以便交易者可以查看和驗證其功能。向作者致敬!雖然您可以免費使用它,但請記住,重新發佈程式碼必須遵守我們的網站規則。
免責聲明
這些資訊和出版物並不意味著也不構成TradingView提供或認可的金融、投資、交易或其他類型的意見或建議。請在使用條款閱讀更多資訊。
開源腳本
本著TradingView的真正精神,此腳本的創建者將其開源,以便交易者可以查看和驗證其功能。向作者致敬!雖然您可以免費使用它,但請記住,重新發佈程式碼必須遵守我們的網站規則。
免責聲明
這些資訊和出版物並不意味著也不構成TradingView提供或認可的金融、投資、交易或其他類型的意見或建議。請在使用條款閱讀更多資訊。