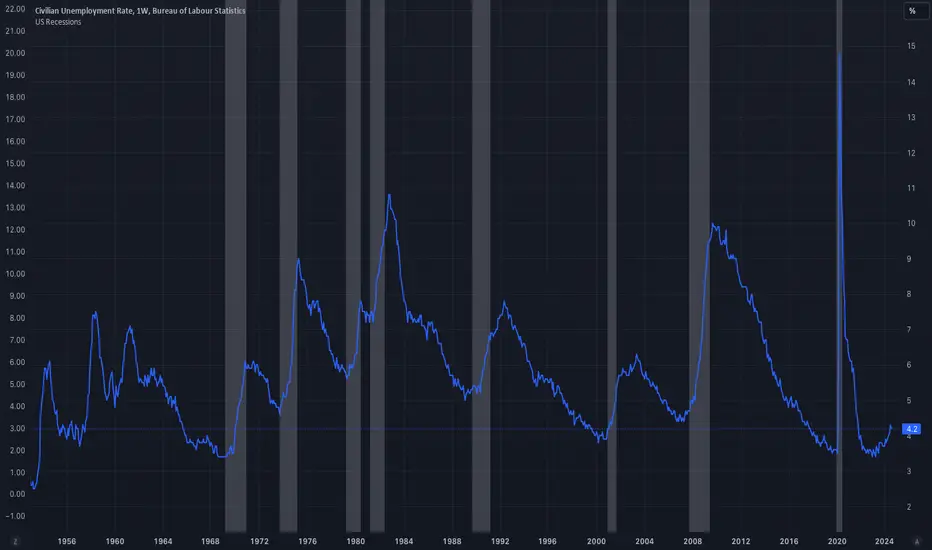
US Recessions based on James Hamilton's JHDUSRGDPBRThis simple script uses James Hamilton's JHDUSRGDPBR indicator to colour areas representing recession periods in the US. Best used in conjunction with other macroeconomics indicators, like –as in the example– unemployment rates
Recession
US Recessions (NBER)This indicator is designed to replace the US Recessions indicator.
Unfortunately, the original indicator is now broken, and the author is not responding: www.tradingview.com .
There are other similar indicators, but they are not based on live data and either show non-officially recognized recessions or fail to display all officially recognized recessions.
This indicator shades US recession periods based on live monthly data from USREC . It highlights all officially recognized US recessions according to the NBER and will automatically shade any future recessions when they occur. The indicator works across all timeframes, correctly shading recessions whether you are viewing a 30-minute, 2-hour, daily, weekly, or any other chart timeframe.
Warning & Risks :
This indicator uses the barmerge.lookahead_on option to correctly handle monthly recession data from USREC . The purpose of this setting is to ensure that the monthly data points are applied retroactively to the corresponding bars on the chart. However, this means that while past recession periods are accurately shaded, the script is effectively displaying data from future candles and plotting it backward onto the chart.
This behavior does not introduce a “future leak” in the traditional sense—since USREC data is backward-looking and the current month always remains non-recessionary until officially confirmed. Nonetheless, it can cause confusion, as users may see recession periods shaded retroactively only after the data becomes available. Therefore, the current month will always appear non-recessionary until the next data point is released, and historical recession periods may be adjusted after the fact .
Economic Growth Index (XLY/XLP)Keeping an eye on the macroeconomic environment is an essential part of a successful investing and trading strategy. Piecing together and analysing its complex patterns are important to detect probable changing trends. This may seem complicated, or even better left to experts and gurus, but it’s made a whole lot easier by this indicator, the Economic Growth Index (EGI).
Common sense shows that in an expanding economy, consumers have access to cash and credit in the form of disposable income, and spend it on all sorts of goods, but mainly crap they don’t need (consumer discretionary items). Companies making these goods do well in this phase of the economy, and can charge well for their products.
Conversely, in a contracting economy, disposable income and credit dry up, so demand for consumer discretionary products slows, because people have no choice but to spend what they have on essential goods. Now, companies making staple goods do well, and keep their pricing power.
These dynamics are represented in EGI, which plots the Rate of Change of the Consumer Discretionary ETF (XLY) in relation to the Consumer Staples ETF (XLP). Put simply, green is an expanding phase of the economy, and red shrinking. The signal line is the market, a smoothed RSI of the S&P500. Run this on a Daily timeframe or higher. Check it occasionally to see where the smart money is heading.

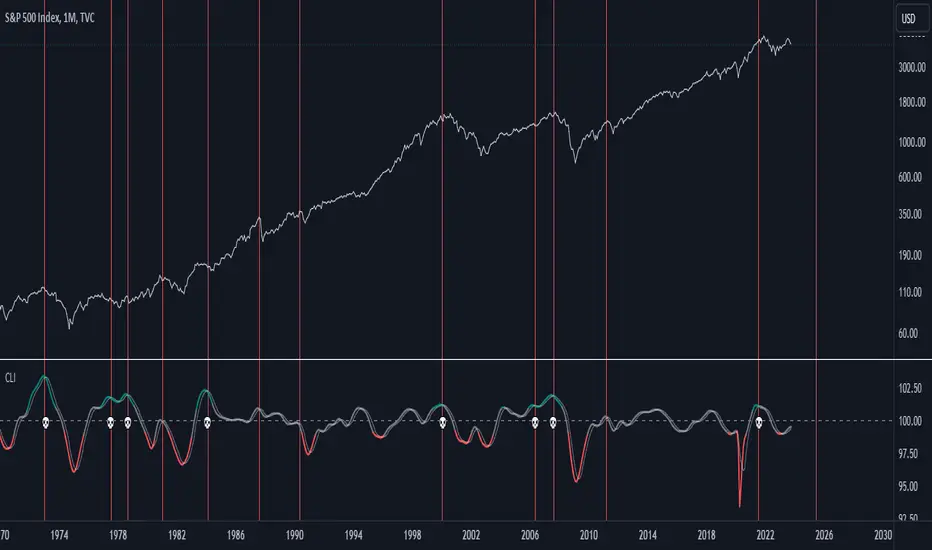
US Composite Leading Indicator (CLI)The US Composite Leading Indicator (CLI), normalized for the United States, closely mirrors the Conference Board "Leading Economic Index" (LEI). It offers unique insights into economic and financial dynamics.
The Composite Leading Indicator (CLI) is an economic tool designed to anticipate economic developments. It is created by aggregating and normalizing a wide range of economic and financial data from various sources.
The normalized data is then aggregated, and a composite indicator is calculated by taking a weighted average of individual indicators.
The CLI is used to provide early insights into the state of the economy and to anticipate future economic trends. It is particularly valuable for predicting economic downturns, including recessions.
The CLI is an essential tool for economists, governments, businesses, and investors seeking to understand economic trends and make informed decisions.
Key Features:
1. Early Warning: Just like its counterpart, the CLI indicator excels at offering early warnings about significant economic events, particularly economic crises. This makes it an indispensable asset for analysts and investors.
2. Recession Indicators: The moving average serves as an early warning system for potential economic recessions. When it crosses the indicator line from the bottom to the top while surpassing a predefined threshold (e.g., 101), it signals a potential crisis.
3. Market Impact: The CLI indicator provides valuable insights into the performance of financial markets, offering cues about indices such as the S&P 500, Nasdaq, Dow Jones, and more.
Why It Matters:
Understanding the US Composite Leading Indicator (CLI) indicator, normalized for the United States, is crucial for anticipating economic shifts and preparing for changes in financial markets. By analyzing a diverse array of economic factors, it provides a holistic view of economic well-being. Whether you're an investor or economist, this indicator can be an invaluable resource for staying informed about market trends and major economic developments.
Source:
www.data.oecd.org
Treasury Yields Heatmap [By MUQWISHI]▋ INTRODUCTION :
The “Treasury Yields Heatmap” generates a dynamic heat map table, showing treasury yield bond values corresponding with dates. In the last column, it presents the status of the yield curve, discerning whether it’s in a normal, flat, or inverted configuration, which determined by using Pearson's linear regression coefficient. This tool is built to offer traders essential insights for effectively tracking bond values and monitoring yield curve status, featuring the flexibility to input a starting period, timeframe, and select from a range of major countries' bond data.
_______________________
▋ OVERVIEW:
______________________
▋ YIELD CURVE:
It is determined through Pearson's linear regression coefficient and considered…
R ≥ 0.7 → Normal
0.7 > R ≥ 0.35 → Slight Normal
0.35 > R > -0.35 → Flat
-0.35 ≥ R > -0.7 → Slight Inverted
-0.7 ≥ R → Inverted
_______________________
▋ INDICATOR SETTINGS:
#Section One: Table Setting
#Section Two: Technical Setting
(1) Country: Select country’s treasury yields data
(2) Timeframe: Time interval.
(3) Fetch By:
(3A) Date: Retrieve data by beginning of date.
(3B) Period: Retrieve data by specifying the number of time series back.
Enjoy. Please let me know if you have any questions.
Thank you.

US Recession IndicatorThe US Recession Indicator is designed to identify recessions as they happen, using two reputable indicators that have accurately foreseen all past recessions since 1969. Unlike the National Bureau of Economic Research (NBER) which determines recession dates after the fact, this indicator seeks to spot recessions in real-time. When both of these distinct metrics meet certain criteria, the chart's background becomes shaded, signifying a strong likelihood that the economy is in a recession. Furthermore, a built-in alert system keeps users updated without constant monitoring.
The first metric is the Smoothed Recession Probabilities developed by Marcelle Chauvet. It is based on a dynamic-factor markov-switching model that assesses four monthly coincident variables: non-farm payroll employment, the index of industrial production, real personal income excluding transfer payments and real manufacturing and trade sales. It offers a mathematical analysis of how recessions deviate from expansions. In essence, this index mirrors the probability of the prevailing true economic situation being a recession, grounded on the current GDP data.
The second metric is the Sahm Rule Recession Indicator developed by Claudia Sahm. It operates on the principle that changes in the unemployment rate can be used to identify the onset of a recession. According to this rule, if the three-month moving average of the unemployment rate rises by 0.5 percentage points or more above its lowest point from the preceding year, it flags a potential recession.
For this combined indicator, the thresholds are intentionally set lower than when each metric is used individually. Both metrics must simultaneously suggest a potential recession in order to send a signal. This stems from the realisation that neither metric is infallible and has, on occasion, sent false signals in the past. By requiring both to align, the likelihood of a false positive is reduced. However, it's crucial to understand that past performance does not guarantee future results, leaving the door open for potential false alerts which may not be confirmed by the NBER.

US Inversions & RecessionsUnderstand when the US yield curve inverted and when recessions took place. Select from Federal Funds Rate, 3 month yield, 2 year yield and 10 year yield.
Default ratio = Federal Funds Rate / 10 year yield
When line goes from white to red = inversion
When line goes from red to white = un-inversion
Yellow shading shows times when the rates are inverted.
Blue shading shows when recessions officially occurred.

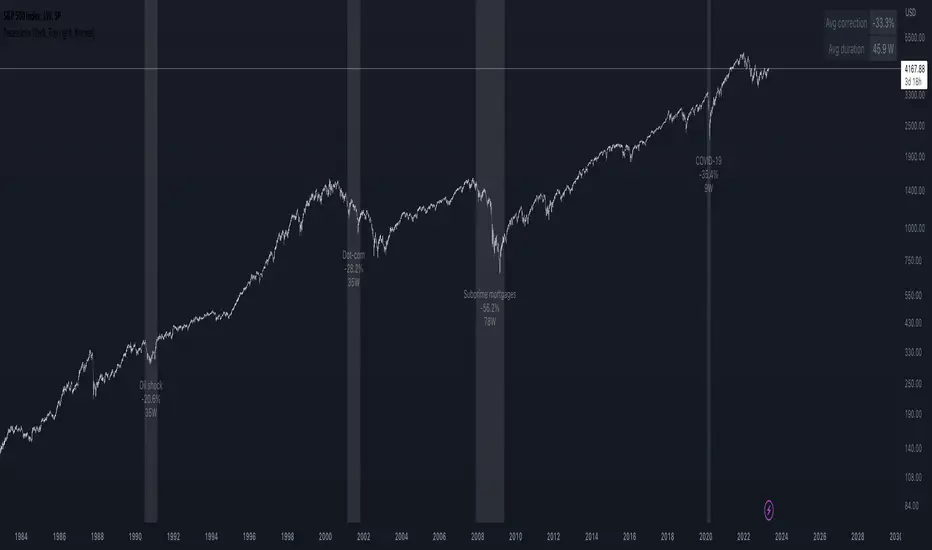
Recessions & crises shading (custom dates & stats)Shades your chart background to flag events such as crises or recessions, in similar fashion to what you see on FRED charts. The advantage of this indicator over others is that you can quickly input custom event dates as text in the menu to analyse their impact for your specific symbol. The script automatically labels, calculates and displays the peak to through percentage corrections on your current chart.
By default the indicator is configured to show the last 6 US recessions. If you have custom events which will benefit others, just paste the input string in the comments below so one can simply copy/paste in their indicator.
Example event input (No spaces allowed except for the label name. Enter dates as YYYY-MM-DD.)
2020-02-01,2020-03-31,COVID-19
2007-12-01,2009-05-31,Subprime mortgages
2001-03-01,2001-10-30,Dot-com bubble
1990-07-01,1991-03-01,Oil shock
1981-07-01,1982-11-01,US unemployment
1980-01-01,1980-07-01,Volker
1973-11-01,1975-03-01,OPEC
Recession Warning Traffic LightThis is an indicator that uses 6 different metrics to determine the combined probability of a recession and compares the high probability warning periods against actual historical periods of recession.
GREEN tells us that the referenced recession indicators are not exhibiting any warning. Observe the long stretches of “all-green” in between recessionary periods in the chart above.
RED will show a full-on warning level for that particular recession indicator, signaling that monitoring of this sector is clearly showing a problem – which has in the past, reliably exhibited itself as a forewarning of recessions.
Adding green and red together can help determine a combined probability of recession.
IMPORTANT: Your chart should be on 1d and set to SPX , DJI ,or NDQ indices
Precious metals: This indicator calculates the relative prices of Gold & rhodium. Gold is a flight-to-quality asset. Rhodium is the rarest of precious industrial metals and prices spike when the economy is heating up. In front of a recession, the upper relative movement of rhodium precedes gold.
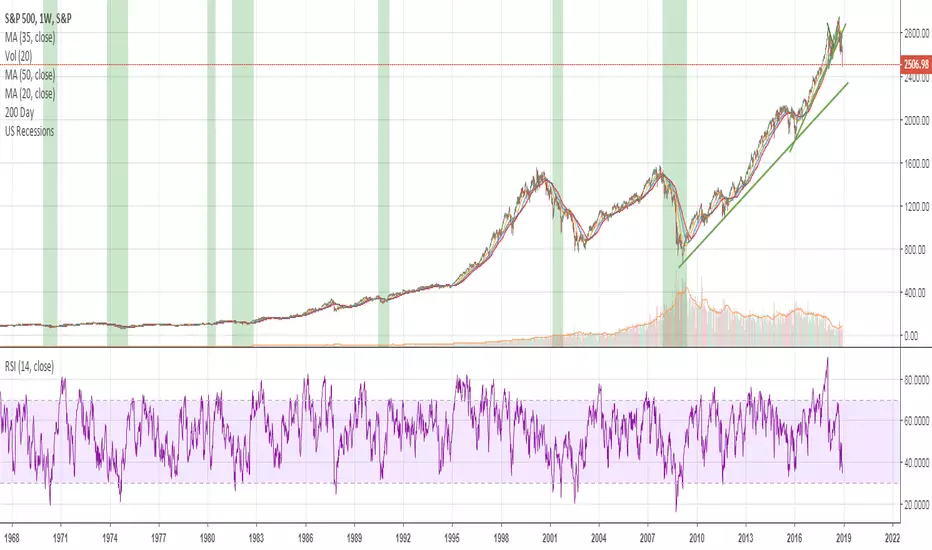
Stock markets: This indicator compares closing prices to growth rate curves of the SPX. This indication is the noisiest but tells us very well when the recession has ended. Stock market indices, which respond to “smart money” moving out of markets when the other indicators begin to warn of recession, or when markets become overheated and rise to historically unsustainable levels.
Yield curve: This indicator compares the 3m & 10y treasuries and detects yield curve inversions. Interest rates are controlled by the Federal Reserve and by the purchasers in the Federal Treasury auction markets, which together create the treasury yield curve. This inversion is the most reliable recession indicator. These happen during a flight to quality.
Federal Reserve: This indicator measures GDP and detects contraction which is technically a recession. This is usually one of the last indicators to enter a Warning state, and it could be 6 months delayed simply confirming what may have already been projected.
Money Supply. This indicator measures the M2 money supply, which typically grows about 1% per calendar quarter. When this shrinks, it's tapping the brakes on the economy. This can also lead to yield curve inversion. This is also a measure of inflation and its effects on the aggregate money supply (liquid capital) available for short-term economic activity, or which can be directed into the purchase of long-term, less liquid assets.
Leading Economic factors: There is a whole basket of leading economic indicators that, as collections, reflect overall growth or contraction of economic activity. These indicators include measures of level and growth in productivity, employment, housing, consumer confidence, industrial purchasing confidence, and much more. These indicators may or may not be detached from the broader economy, and often provide up to 6 months of foresight. For more information please visit www.conference-board.org
Actual Recession: Central Bank indicators are published by the Federal Reserve and reflect their own analysis of national and regional economic health, as well as their calculations of the likelihood of a recession. The Federal Reserve has a recession ticker which is used to plot periods of actual recessions on this indicator for comparison.

Yield Curve (1-10yr)Yield curve of the 1-10 year US Treasury Bonds, with over 60 years of history.
The Yield Curve is the interest rate on the 10 year bond minus the 1 year bond.
When it inverts (crosses under 0) a recession usually follows 6-12 months later.
It's a great leading indicator to identify risk in the macroeconomic environment.
Yield curves can be constructed on varying durations. Using a 1-year as the short-term bond provides a slightly faster response than the 2-year bond; and the 1-year has more historical data on TradingView.

Multi Yield CurveAn inversion between the 2 year and 10 year US treasury yield generally means a recession within 2 years. But the yield curve has more to it than that. This script helps analysis of the current and past yield curve (not limited to US treasury) and is very configurable.
"A yield curve is a line that plots yields (interest rates) of bonds having equal credit quality but differing maturity dates. The slope of the yield curve gives an idea of future interest rate changes and economic activity." (Investopedia)
When the slope is upward (longer maturity bonds have a higher interest rate than shorter maturity bonds), it generally means the economy is doing well and is expanding. When the slope is downward it generally means that there is more downside risk in the future.
The more inverted the curve is, and the more the inversion moves to the front, the more market participants are hedging against downside risk in the future.
The script draws up to 4 moments of a yield curve, which makes it easy to compare the current yield curve with past yield curves. It also draws lines in red when that part of the curve is inverted.
The script draws the lines with proper length between maturity (which most scripts do not) in order to make it more representative of the real maturity duration. The width cannot be scaled because TradingView does not allow drawing based on pixels.
This script is the only free script at time of writing with proper lengths, showing multiple yield curves, and being able to show yield curves other than the US treasury.
█ CONFIGURATION
(The following can be configured by clicking "Settings" when the script is added to a chart)
By default the script is configured to show the US treasury (government bond) yields of all maturities, but it can be configured for any yield curve.
A ticker represents yield data for a specific maturity of a bond.
To configure different tickers, go to the "TICKERS" section. Tickers in this section must be ordered from low maturity to high maturity.
• Enable: draw the ticker on the chart.
• Ticker: ticker symbol on TradingView to fetch data for.
• Months: amount of months of bond maturity the ticker represents.
To configure general settings, go to the "GENERAL" section.
• Period: used for calculating how far back to look for data for past yield curve lines. See "Times back" further in this description for more info.
• Min spacing: minimum amount of spacing between labels. Depending on the size of the screen, value labels can overlap. This setting sets how much empty space there must be between labels.
• Value format: how the value at that part of the line should be written on the label. For example, 0.000 means the value will have 3 digits precision.
To configure line settings per yield curve, each has its own "LINE" section with the line number after it.
• Enable: whether to enable drawing of this line.
• Times back: how many times period to go back in time. When period is D, and times value is 2, the line will be of data from 2 days ago.
• Color: color of the line when not inverted.
• Style: style of the line. Possible values: sol, dsh, dot
• Inversion color: color of the line when the curve inverses between the two maturities at that part of the curve.
• Thickness: thickness of the line in pixels.
• Labels: whether to draw value labels above the line. By default, this is only enabled for the first line.
• Label text color: text color of value label.
• Label background color: background color of value label.
To configure the durations axis at the bottom of the chart, go to the "DURATIONS" section.
• Durations: whether to show maturity term duration labels below the chart.
• Offset: amount to offset durations label to be below chart.
█ MISC
Script originally inspired by the US Treasury Yield Curve script by @longfiat but has been completely rewritten and changed.

Historical US Bond Yield CurvePreface: I'm just the bartender serving today's freshly blended concoction; I'd like to send a massive THANK YOU to all the coders and PineWizards for the locally-sourced ingredients. I am simply a code editor, not a code author. Many thanks to these original authors!
Source 1 (Aug 8, 2019):
Source 2 (Aug 11, 2019):
About the Indicator: The term yield curve refers to the yields of U.S. treasury bills, notes, and bonds in order from shortest to longest maturity date. The yield curve describes the shapes of the term structures of interest rates and their respective terms to maturity in years. The slope of the yield curve tells us how the bond market expects short-term interest rates to move in the future based on bond traders' expectations about economic activity and inflation. The best use of the yield curve is to get a sense of the economy's direction rather than to try to make an exact prediction. This indicator plots the U.S. yield curve as maturity (x-axis/time) vs yield (y-axis/price) in addition to historical yield curves and advanced data tickers . The visual array of historical yield curves helps investors visualize shifts in the yield curve that are useful when identifying & forecasting economic conditions. The bond market can help predict the direction of the economy which can be useful in crafting your investment strategy. An inverted 10y/2y yield curve for durations longer than 5 consecutive trading days signals an almost certain recession on the horizon. An inversion happens when short-term bonds pay better than longer-term bonds. There is Federal Reserve Board data that suggests the 10y3m may be a better predictor of recessions.
Features: Advanced dual data ticker that performs curve & important spread analysis, plus additional hover info. Advanced yield curve data labels with additional hover info. Customizable historical curves and color theme.
‼ IMPORTANT: Hover over labels/tables for advanced information. Chart asset and timeframe may affect the yield curve results; I have found consistently accurate results using BINANCE:BTCUSDT on 1d timeframe. Historical curve lookbacks will have an effect on whether the curve analysis says the curve is bull/bear steepening/flattening, so please use appropriate lookbacks.
⚠ DISCLAIMER: Not financial advice. Not a trading system. DYOR. I am not affiliated with the original authors, TradingView, Binance, or the Federal Reserve Board.
About the Editor: I am a former FINRA Registered Representative, inventor/patent holder, futures trader, and hobby PineScripter.

Eurobond CurveABOUT
Dynamically plots 3 no. forward EUROBOND curves. When the curves converge (or worse crossover) there is higher risk of financial uncertainty and potential market correction.
The Eurobond Curves work in a similar way to treasury "yield curve inversion"; except the EUROBOND curves can signal much earlier than Treasuries therefore providing a leading indicator.
The indicator looks the the "near" (next year EUROBOND), "mid" (EUROBOND 2 years out) and "far" (EUROBOND 5 years out) to assess for crossovers.
When the "near" and "mid" curves crossover the "far" curve, concerning economic conditions are developing and it may be a good idea to reduce risk exposure to markets.
LIMITATIONS
The EUROBOND curve crossover events are rare, and this indicator uses data back to 2005 (using approximately 25 TradingView security functions). Given there are relatively few crossover events, the reliability of this indicator should be considered low. Nonetheless, there is decent alignment with treasury yield curve inversions in the 20 year period assessed. Given treasury yield curve inversions have predicted every recession for the last 70 years, we still think the EUROBOND Curves are a useful datapoint to monitor into the future and provide confluence to other risk management strategies.

Sahm Rule Recession Indicator (by Alex L.)Real-time Sahm Rule Recession Indicator (idea by Claudia Sahm) based on US national unemployment rate.
I added an enhanced feature (optional) that uses slight variation in Sahm's idea and is usable to detect oversold stocks/crypto.
Enjoy!

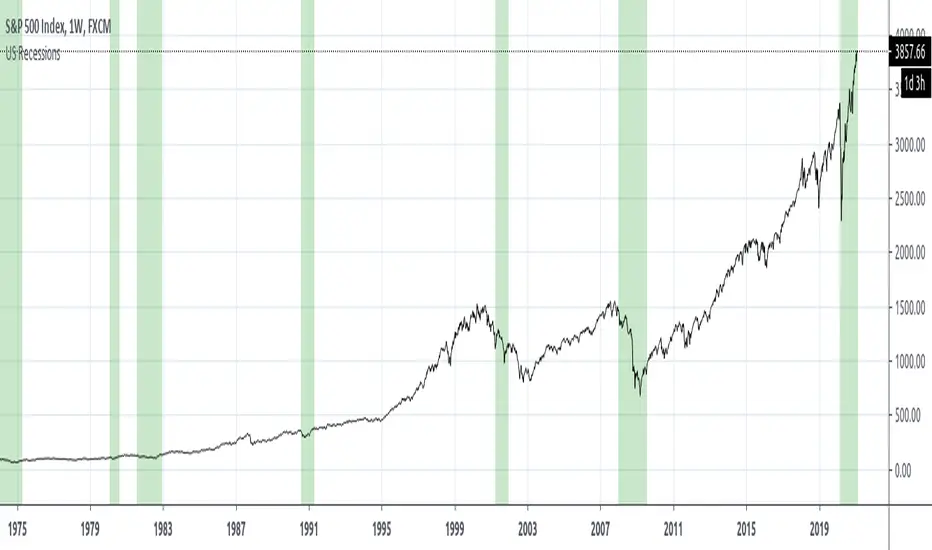
US RecessionsThere are a couple of other Pine Scripts on TradingView that others have kindly contributed but they are presently out-dated because they shade recessions based on manual entries of time. Thanks to the availability of pulling data from QUANDL, we can pull official data from FRED on data like US Recessions.
The FRED series data is taken from is here- fred.stlouisfed.org
"Our time series is composed of dummy variables that represent periods of expansion and recession. A value of 1 is a recessionary period, while a value of 0 is an expansionary period. For this time series, the recession begins on the 15th day of the month of the peak and ends on the 15th day of the month of the trough. This time series is a disaggregation of the monthly series."
This series tracks back to 1854, but good luck finding much of any data on TradingView that goes that far back :)
Yield CurveThis script tracks the U.S. 2Yr/10Yr Spread and uses inversions of the curve to predict recessions. Whenever a red arrow appear on the yield curve, expect a recession to begin within the next 2 years. Use this signal to either exit the market, or hedge current positions. Whenever a green arrow appears on the yield curve, expect a recession to have nearly ended. Use this signal to enter the market, or cut current hedges against a recession. (I may update this script in the future to better incorporate the effective federal funds rate into exit points, but for now I am satisfied with the results).

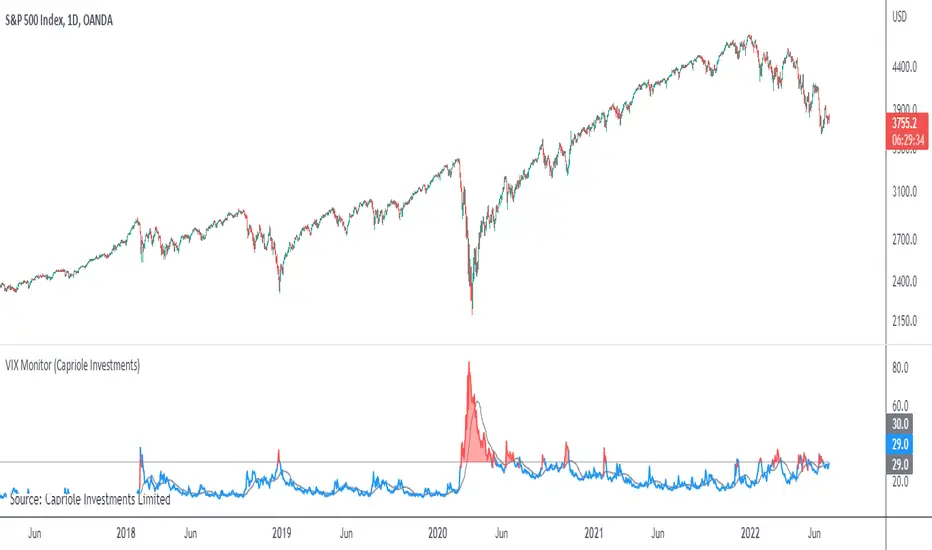
VIX MonitorSimple VIX Monitor to track spikes.
Spikes in VIX are often followed by big moves up in stocks.
Useful when paired with "Correlation & Beta" Indicator.
For Bitcoin Traders: when Bitcoin is highly correlated to Stocks (such as now) it could be a good opportunity for a short-term long trade.
Yield Curve Inversion MonitorIdentifies when the US Treasury Yield Curve inverts (2 and 10 year bond rates).
When they ‘invert’ long-term bonds have a lower interest rate than short-term bonds. In other words, the bond market is pricing in a significant drop in future interest rates (which might be caused by the US Fed fighting off a recession in the future).
In the last 50 years, every time the US treasury yield curve inverted a recession followed within 3 years. On average the S&P500 gained 19.1% following the inversion and peaked 13 months later. In other words, as far as investors are concerned, the recession began roughly one year later.
However, once the market peaks, it then drops 37.6% on average, wiping out all those gains and more.
...Looks like 2020 is shaping up to be another prime example.

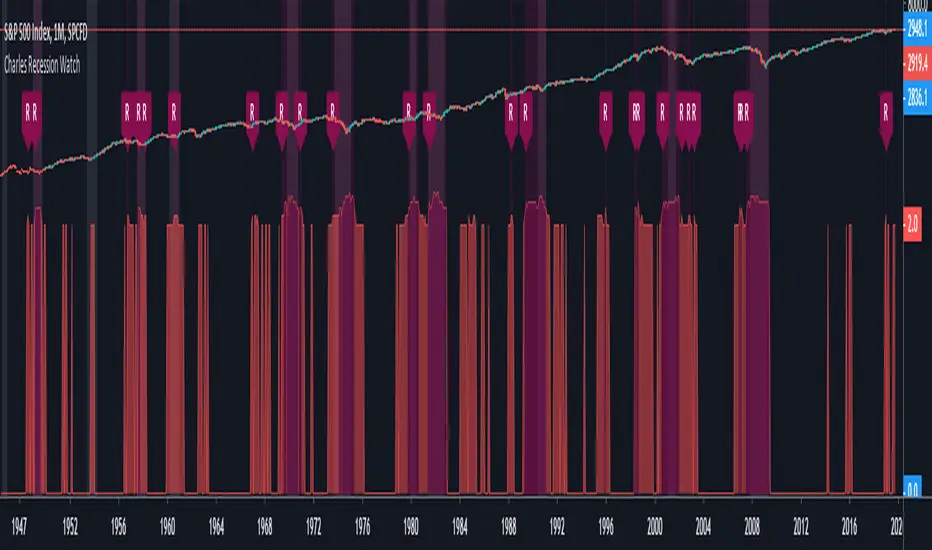
Charles Recession WatchThe “Recession Watch” indicator tracks 7 key economic metrics which have historically preceded US recessions. It provides a real-time indication of incoming recession risk.
This indicator gives a picture of when risk is increasing, and therefore when you might want to start taking some money out of risky assets.
All of the last seven recessions were preceded by a risk score of 3 or higher. Six of them were preceded by a risk score of 4 or higher. Unfortunately data prior to 1965 was inconsistent and prior recessions could not be considered.
Based on the indicator hit rate at successfully flagging recessions over the last 50 years, risk scores have the following approximate probabilities of recession:
- 0-1: Low
- 2: 25% within next 18 months
- 3: 30% within next 12 months
- 4-7: 50% within next 12 months
Note that a score of 3 is not necessarily a cause for panic. After all, there are substantial rewards to be had in the lead up to recessions (averaging 19% following yield curve inversion). For the brave, staying invested until the score jumps to 4+, or until the S&P500 drops below the 200day MA, will likely yield the best returns.
Notes on use:
- use MONTHLY time period only (the economic metrics are reported monthly)
- If you want to view the risk Score (1-7) you need to set your chart axis to "Logarithmic"
Enjoy and good luck!
Bond Yield Recession IndicatorThis model uses the difference between 10-year and 3-month Treasury rates to calculate the probability of a recession in the United States twelve months ahead.
By a simple gimpse, it has been correct for the last two recessions of 2000 and 2008.
www.newyorkfed.org
fred.stlouisfed.org

US Recessions Credit to Sinuhet for creating the primary script. My change just gets rid of the bug that had erred in indicating another recession in 2015/2016.
U.S. Stocks & Options CVI to Bitcoin Correlation [NeoButane]Conceptual indicator based on trying to find an inverse correlation between bitcoin and traditional markets due to bitcoin's usefulness as a hedge against economic downturns.
How to use this script: you look at it and see if there is a correlation or not between bitcoin/Ethereum price and either U.S. stock CVi, buy volume, sell volume, calls, puts, or the call/put ratio.
