OPEN-SOURCE SCRIPT
已更新 Best Support And Resistance Indicator V1 [ForexBee]
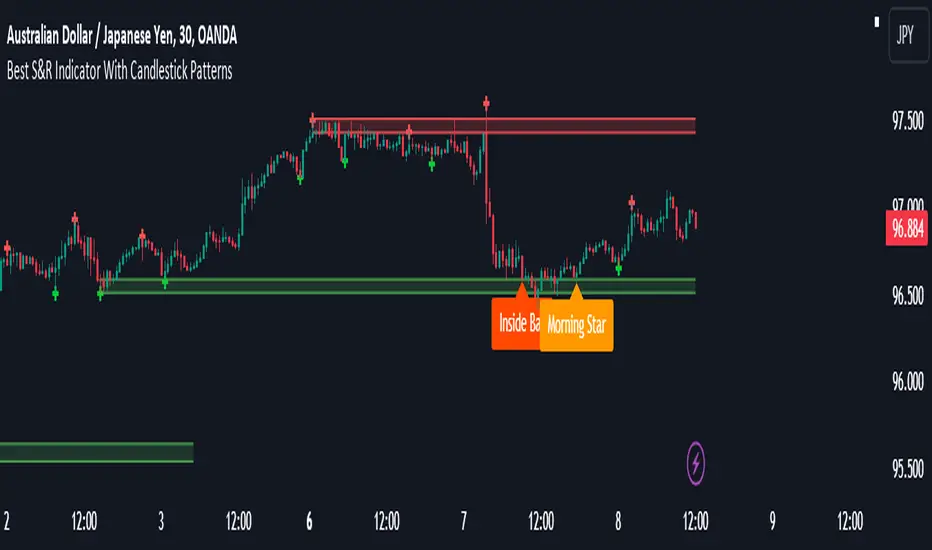
This Indicator Identifies and draws the support and resistance Zones On the Chart
🔶Overview
The support and resistance indicator is a technical indicator that will plot the support zone and resistance zone on the candlestick chart. It determines the price touches to find the strong support resistance zones.
The support and resistance indicator is the most basic technical analysis in trading. Instead of drawing zones manually, this indicator can save you time by plotting zones automatically.

🔶Working
There are specific characteristics of a valid support and resistance zone. Price always bounces upward from the support zone while it bounces downward from the resistance zone. On the other hand, when a breakout of the support or resistance zone happens, the price trends toward the breakout.
🔶Valid support zone
When the price touches a zone two to three times and bounces in a bullish direction, it is a good support zone.
The main point is that you should always find the bounces in clear price swings. The touches or bounces of the price must not be in the form of a choppy market. Price always moves in the form of swings or waves.

🔶Valid resistance zone
When the price touches a zone two to three times with a bounce in a bearish direction, then a valid resistance zone forms.
Here the price bounces must be in the form of swings or waves. You must avoid a choppy market.
So the support and resistance zone indicator finds these parameters on the chart and draws only valid zones.

🔶Settings of indicator

There are two inputs available in the indicator.
Number of bars for swing
The number of bars for the swing bars represents the size of the swing for a valid support or resistance touch. This parameter helps to filter the ranging price. the default value is 10.
Number of Tests for valid support and resistance
In this indicator, the number of pivots represents the support or resistance touches. so if you select the number 3, the indicator will only draw a zone with three touches.
🔶Features
There are the following features that this indicator identifies automatically, so you don’t need to do manual work.
We are also adding the feature of a candlestick pattern at the zone, which will be added in the next update.
🔶Overview
The support and resistance indicator is a technical indicator that will plot the support zone and resistance zone on the candlestick chart. It determines the price touches to find the strong support resistance zones.
The support and resistance indicator is the most basic technical analysis in trading. Instead of drawing zones manually, this indicator can save you time by plotting zones automatically.
🔶Working
There are specific characteristics of a valid support and resistance zone. Price always bounces upward from the support zone while it bounces downward from the resistance zone. On the other hand, when a breakout of the support or resistance zone happens, the price trends toward the breakout.
🔶Valid support zone
When the price touches a zone two to three times and bounces in a bullish direction, it is a good support zone.
The main point is that you should always find the bounces in clear price swings. The touches or bounces of the price must not be in the form of a choppy market. Price always moves in the form of swings or waves.
🔶Valid resistance zone
When the price touches a zone two to three times with a bounce in a bearish direction, then a valid resistance zone forms.
Here the price bounces must be in the form of swings or waves. You must avoid a choppy market.
So the support and resistance zone indicator finds these parameters on the chart and draws only valid zones.
🔶Settings of indicator
There are two inputs available in the indicator.
Number of bars for swing
The number of bars for the swing bars represents the size of the swing for a valid support or resistance touch. This parameter helps to filter the ranging price. the default value is 10.
Number of Tests for valid support and resistance
In this indicator, the number of pivots represents the support or resistance touches. so if you select the number 3, the indicator will only draw a zone with three touches.
🔶Features
There are the following features that this indicator identifies automatically, so you don’t need to do manual work.
- Identify the valid support and resistance zones
- Add the confluence of swings or waves during zone identification
- Choppy market filter
We are also adding the feature of a candlestick pattern at the zone, which will be added in the next update.
發行說明
Added Alerts For The Detection Of Support And Resistance Zones發行說明
Now The indicator Also Shows Candlestick Patterns at support and resistance levels.發行說明
Updated The Confluences開源腳本
秉持TradingView一貫精神,這個腳本的創作者將其設為開源,以便交易者檢視並驗證其功能。向作者致敬!您可以免費使用此腳本,但請注意,重新發佈代碼需遵守我們的社群規範。
ForexBee
免責聲明
這些資訊和出版物並非旨在提供,也不構成TradingView提供或認可的任何形式的財務、投資、交易或其他類型的建議或推薦。請閱讀使用條款以了解更多資訊。
開源腳本
秉持TradingView一貫精神,這個腳本的創作者將其設為開源,以便交易者檢視並驗證其功能。向作者致敬!您可以免費使用此腳本,但請注意,重新發佈代碼需遵守我們的社群規範。
ForexBee
免責聲明
這些資訊和出版物並非旨在提供,也不構成TradingView提供或認可的任何形式的財務、投資、交易或其他類型的建議或推薦。請閱讀使用條款以了解更多資訊。