OPEN-SOURCE SCRIPT
Gold Lagging (N days)
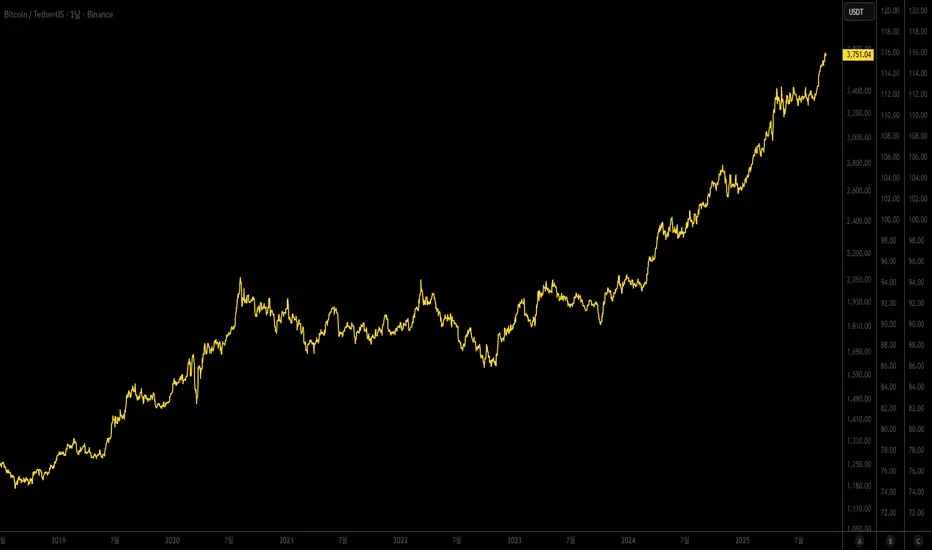
This indicator overlays the price of gold (XAUUSD) on any chart with a customizable lag in days. You can choose the price source (open, high, low, close, hlc3, ohlc4), shift the series by a set number of daily bars, and optionally normalize the values so that the first visible bar equals 100. The original gold line can also be displayed alongside the lagged series for direct comparison.
It is especially useful for analyzing delayed correlations between gold and other assets, observing shifts in safe-haven demand, or testing hypotheses about lagging market reactions. Since the lag is calculated on daily data, it remains consistent even if applied on intraday charts, while the indicator itself can be plotted on a separate price scale for clarity.
이 지표는 금(XAUUSD) 가격을 원하는 차트 위에 N일 지연된 형태로 표시합니다. 가격 소스(시가, 고가, 저가, 종가, hlc3, ohlc4)를 선택할 수 있으며, 지정한 일 수만큼 시리즈를 뒤로 이동시킬 수 있습니다. 또한 첫 값 기준으로 100에 맞춰 정규화하거나, 원래 금 가격선을 함께 표시해 비교할 수도 있습니다.
금과 다른 자산 간의 지연 상관관계를 분석하거나 안전자산 수요 변화를 관찰할 때 유용하며, 시장 반응의 시차 효과를 검증하는 데에도 활용할 수 있습니다. 지연은 일봉 데이터 기준으로 계산되므로 단기 차트에 적용해도 일 단위 기준이 유지되며, 별도의 가격 스케일에 표시되어 가독성을 높일 수 있습니다.
開源腳本
秉持TradingView一貫精神,這個腳本的創作者將其設為開源,以便交易者檢視並驗證其功能。向作者致敬!您可以免費使用此腳本,但請注意,重新發佈代碼需遵守我們的社群規範。
토미 유튜브: youtube.com/@TommyTradingTV
제 모든 인사이트, 분석, 관점은 t.me/tommy_trading 에 가장 먼저 올라갑니다!
제 모든 인사이트, 분석, 관점은 t.me/tommy_trading 에 가장 먼저 올라갑니다!
免責聲明
這些資訊和出版物並非旨在提供,也不構成TradingView提供或認可的任何形式的財務、投資、交易或其他類型的建議或推薦。請閱讀使用條款以了解更多資訊。