Hello All,
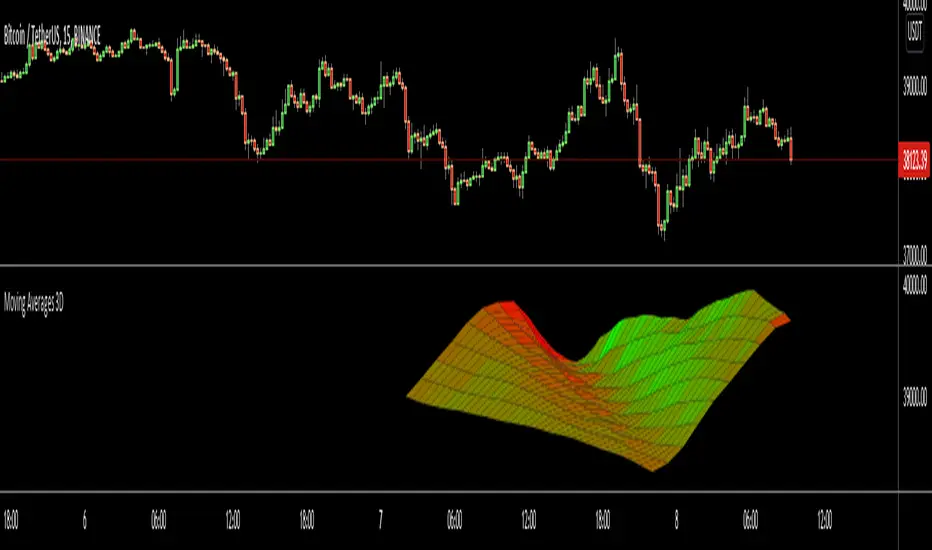
This is an experimental work to show 10 moving averages in 3D by using linefill.new() feature of the Pine language.
You can set moving average type as Simple (SMA) or Exponential (EMA)
You can set "Starting Length" and set the "Step" to calculate other lengths. For example; if "Starting Length" is 10 and "step" is 5 then the lengths are 10, 15, 20, 25...
You can set the colors as Red, Green, Blue for each direction. And you can change the width. you can see the examples below
In following example Green and Blue used:

In following example Blue and Red is used and Width is set as 5:

Enjoy!
This is an experimental work to show 10 moving averages in 3D by using linefill.new() feature of the Pine language.
You can set moving average type as Simple (SMA) or Exponential (EMA)
You can set "Starting Length" and set the "Step" to calculate other lengths. For example; if "Starting Length" is 10 and "step" is 5 then the lengths are 10, 15, 20, 25...
You can set the colors as Red, Green, Blue for each direction. And you can change the width. you can see the examples below
In following example Green and Blue used:
In following example Blue and Red is used and Width is set as 5:
Enjoy!
發行說明
Drawing order and 3d display improved開源腳本
秉持TradingView一貫精神,這個腳本的創作者將其設為開源,以便交易者檢視並驗證其功能。向作者致敬!您可以免費使用此腳本,但請注意,重新發佈代碼需遵守我們的社群規範。
🤝 LonesomeTheBlue community
t.me/LonesomeTheBlue_Official
🎦 YouTube Channel
Youtube.com/@lonesometheblue/videos
💰 Subscription to Pro indicators
Tradingview.com/spaces/LonesomeTheBlue/
t.me/LonesomeTheBlue_Official
🎦 YouTube Channel
Youtube.com/@lonesometheblue/videos
💰 Subscription to Pro indicators
Tradingview.com/spaces/LonesomeTheBlue/
免責聲明
這些資訊和出版物並非旨在提供,也不構成TradingView提供或認可的任何形式的財務、投資、交易或其他類型的建議或推薦。請閱讀使用條款以了解更多資訊。
開源腳本
秉持TradingView一貫精神,這個腳本的創作者將其設為開源,以便交易者檢視並驗證其功能。向作者致敬!您可以免費使用此腳本,但請注意,重新發佈代碼需遵守我們的社群規範。
🤝 LonesomeTheBlue community
t.me/LonesomeTheBlue_Official
🎦 YouTube Channel
Youtube.com/@lonesometheblue/videos
💰 Subscription to Pro indicators
Tradingview.com/spaces/LonesomeTheBlue/
t.me/LonesomeTheBlue_Official
🎦 YouTube Channel
Youtube.com/@lonesometheblue/videos
💰 Subscription to Pro indicators
Tradingview.com/spaces/LonesomeTheBlue/
免責聲明
這些資訊和出版物並非旨在提供,也不構成TradingView提供或認可的任何形式的財務、投資、交易或其他類型的建議或推薦。請閱讀使用條款以了解更多資訊。