OPEN-SOURCE SCRIPT
Normalized MACD with RSI [bkeevil]
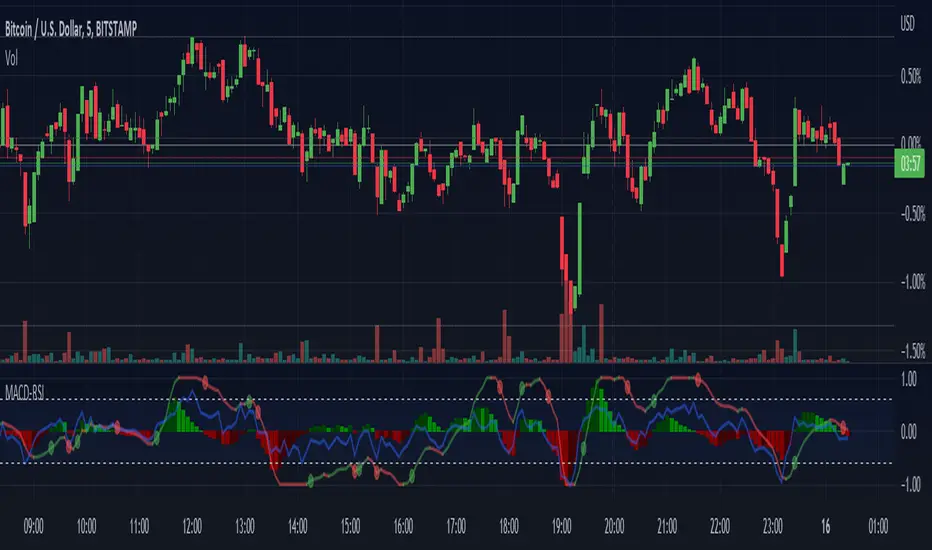
This indicator normalizes the MACD and RSI indicators to a range between -1.0 and 1.0 so they can be displayed together on the same chart to save screen real-estate.
While the MACD is a good indicator to detect trend changes, in some circumstances (such as a sideways range market) it can give false signals. The MACD is more likely to give a false signal when the RSI indicator is close to the centerline than if the RSI is signaling an overbought or oversold condition. Thus the RSI indicator and MACD indicator are commonly used together.
I have included a few features found in other MACD indicators that I have found helpful:
The MACD signal line is hidden it by default as the information it contains is redundant. Hiding the signal line makes the indicator less busy.
While the MACD is a good indicator to detect trend changes, in some circumstances (such as a sideways range market) it can give false signals. The MACD is more likely to give a false signal when the RSI indicator is close to the centerline than if the RSI is signaling an overbought or oversold condition. Thus the RSI indicator and MACD indicator are commonly used together.
I have included a few features found in other MACD indicators that I have found helpful:
- MACD line changes color if it is rising or falling
- Dots at the MACD line to signal crossovers
The MACD signal line is hidden it by default as the information it contains is redundant. Hiding the signal line makes the indicator less busy.
開源腳本
秉持TradingView一貫精神,這個腳本的創作者將其設為開源,以便交易者檢視並驗證其功能。向作者致敬!您可以免費使用此腳本,但請注意,重新發佈代碼需遵守我們的社群規範。
免責聲明
這些資訊和出版物並非旨在提供,也不構成TradingView提供或認可的任何形式的財務、投資、交易或其他類型的建議或推薦。請閱讀使用條款以了解更多資訊。
免責聲明
這些資訊和出版物並非旨在提供,也不構成TradingView提供或認可的任何形式的財務、投資、交易或其他類型的建議或推薦。請閱讀使用條款以了解更多資訊。