INVITE-ONLY SCRIPT
ProfitBee59 v5.0
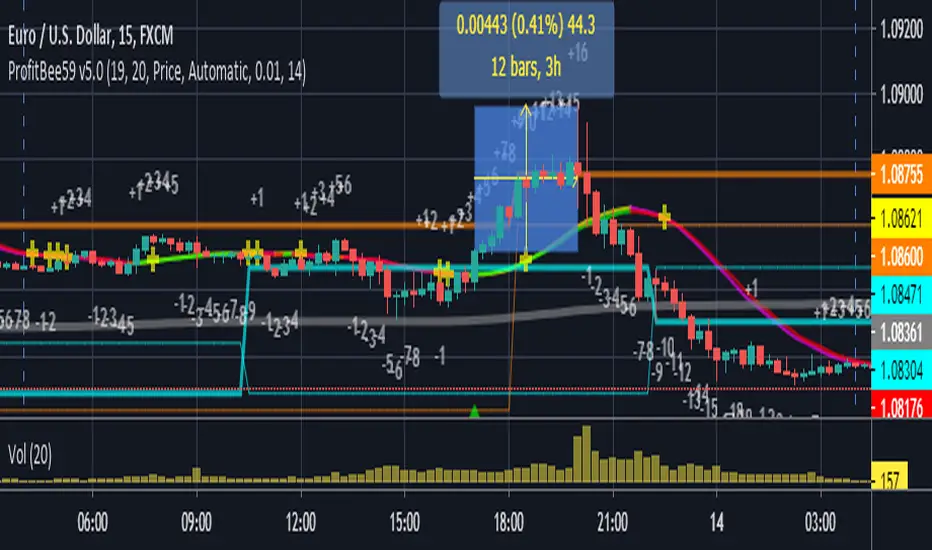
ProfitBee59 v5.0 for TradingView (pb5 ai) helps you do tedious works on your technical charts. It does CC59 counting and prints out positive or negative number on each price bar. When the counting arrives at -9 or +9, it creates respectable support and resistance ( SNR ) levels on the chart. It draws a pair of fast/slow average lines with pink/red colors for corresponding downtrend and yellow/green for uptrend. A yellow cross sign shows a crossing point between these fast/slow average line. It also draws a mega average line in gray to give a mega trend picture. Pb5 ai provides time/price analyseses. Up/Dn arrows are printed out at high probability buy/sell regions. In addition, other auxiliary tools such as Max/Min finder used to find the candlesticks with local max/min prices or Gap finder used to locate discontinuity between candlesticks.
For Forex trading, other intraday parameters are also available including the day opening level, high/low of yesterday and intraday brown background marking time interval for key trading hours in Asian-London-New York markets.
Smart phone/tablet and PC notifications of events occurring in the chart can be sent to you by server-side alerts so that you don't have to stay in front of the screen all the time.
=================================================================
The script ProfitBee59 v5.0 for TradingView (pb5 ai) is locked and protected. Contact the author for your access.
=================================================================
How to install the script:
------------------------------
*Go to the bottom of this page and click on "Add to Favorite Scripts".
*Remove older version of the script by clicking on the "X" button behind the indicator line at the top left corner of the chart window.
*Open a new chart at and click on the "Indicators" tab.
*Click on the "Favorites" tab and choose "ProfitBee59 v5.0".
*Right click anywhere on the graph, choose "Color Theme", the select "Dark".
*Right click anywhere on the graph, choose "Settings".
*In "Symbol" tab, set "Precision" to 1/100 for stock price or 1/100000 for Forex and set "Time Zone" to your local time.
*In "Scales" tab, check "Indicator Last Value Label".
*In "Events" tab, check "Show Dividends on Chart", "Show Splits on Chart" and "Show Earnings on Chart".
*At the bottom of settings window, click on "Template", "Save As...", then name this theme of graph setting for future call up such as "My chart setting".
*Click OK.
僅限邀請腳本
只有經作者授權的使用者才能訪問此腳本,且通常需付費。您可以將此腳本加入收藏,但需先向作者申請並獲得許可後才能使用 — 點擊此處了解更多。如需更多詳情,請依照作者說明或直接聯繫nimit.chomnawang。
除非您完全信任其作者並了解腳本的工作原理,否則TradingView不建議您付費或使用腳本。您也可以在我們的社群腳本中找到免費的開源替代方案。
作者的說明
提醒:在請求訪問權限之前,請閱讀僅限邀請腳本指南。
To get access to ProfitBee59 stock graph ai for TradingView and my other invite-only scripts, please go to [ ProfitBee59.com ].
Please do not ask about access to use scripts in the script's comment section.
Please do not ask about access to use scripts in the script's comment section.
免責聲明
這些資訊和出版物並不意味著也不構成TradingView提供或認可的金融、投資、交易或其他類型的意見或建議。請在使用條款閱讀更多資訊。