▋ INTRODUCTION :
The “Index Generator” simplifies the process of building a custom market index, allowing investors to enter a list of preferred holdings from global securities. It aims to serve as an approach for tracking performance, conducting research, and analyzing specific aspects of the global market. The output will include an index value, a table of holdings, and chart plotting, providing a deeper understanding of historical movement.
_______________________
▋ OVERVIEW:

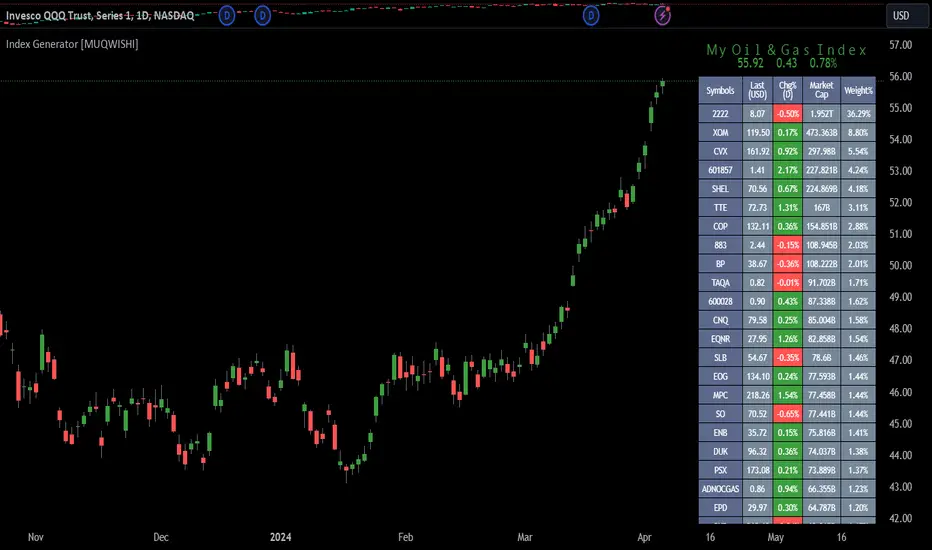
The image can be taken as an example of building a custom index. I created this index and named it “My Oil & Gas Index”. The index comprises several global energy companies. Essentially, the indicator weights each company by collecting the number of shares and then computes the market capitalization before sorting them as seen in the table.
_______________________
▋ OUTPUTS:
The output can be divided into 3 sections:
1. Index Title (Name & Value).
2. Index Holdings.
3. Index Chart.

1. Index Title, displays the index name at the top, and at the bottom, it shows the index value, along with the daily change in points and percentage.

2. Index Holdings, displays list the holding securities inside a table that contains the ticker, price, daily change %, market cap, and weight %. Additionally, a tooltip appears when the user passes the cursor over a ticker's cell, showing brief information about the company, such as the company's name, exchange market, country, sector, and industry.

3. Index Chart, display a plot of the historical movement of the index in the form of a bar, candle, or line chart.

_______________________
▋ INDICATOR SETTINGS:

(1) Naming the index.
(2) Entering a currency. To unite all securities in one currency.
(3) Table location on the chart.
(4) Table’s cells size.
(5) Table’s colors.
(6) Sorting table. By securities’ (Market Cap, Change%, Price, or Ticker Alphabetical) order.
(7) Plotting formation (Candle, Bar, or Line)
(8) To show/hide any indicator’s components.
(9) There are 34 fields where user can fill them with symbols.
Please let me know if you have any questions.
The “Index Generator” simplifies the process of building a custom market index, allowing investors to enter a list of preferred holdings from global securities. It aims to serve as an approach for tracking performance, conducting research, and analyzing specific aspects of the global market. The output will include an index value, a table of holdings, and chart plotting, providing a deeper understanding of historical movement.
_______________________
▋ OVERVIEW:
The image can be taken as an example of building a custom index. I created this index and named it “My Oil & Gas Index”. The index comprises several global energy companies. Essentially, the indicator weights each company by collecting the number of shares and then computes the market capitalization before sorting them as seen in the table.
_______________________
▋ OUTPUTS:
The output can be divided into 3 sections:
1. Index Title (Name & Value).
2. Index Holdings.
3. Index Chart.
1. Index Title, displays the index name at the top, and at the bottom, it shows the index value, along with the daily change in points and percentage.
2. Index Holdings, displays list the holding securities inside a table that contains the ticker, price, daily change %, market cap, and weight %. Additionally, a tooltip appears when the user passes the cursor over a ticker's cell, showing brief information about the company, such as the company's name, exchange market, country, sector, and industry.
3. Index Chart, display a plot of the historical movement of the index in the form of a bar, candle, or line chart.
_______________________
▋ INDICATOR SETTINGS:
(1) Naming the index.
(2) Entering a currency. To unite all securities in one currency.
(3) Table location on the chart.
(4) Table’s cells size.
(5) Table’s colors.
(6) Sorting table. By securities’ (Market Cap, Change%, Price, or Ticker Alphabetical) order.
(7) Plotting formation (Candle, Bar, or Line)
(8) To show/hide any indicator’s components.
(9) There are 34 fields where user can fill them with symbols.
Please let me know if you have any questions.
發行說明
Fixed tooltip bug. 開源腳本
秉持TradingView一貫精神,這個腳本的創作者將其設為開源,以便交易者檢視並驗證其功能。向作者致敬!您可以免費使用此腳本,但請注意,重新發佈代碼需遵守我們的社群規範。
Trusted Pine Programmer, For Coding Inquiries
► Website muqwishi.com/home/quotation/
► Telegram t.me/MUQWISHI
► Email service@muqwishi.com
⛾ Support My Work on “Buy Me a Coffee” buymeacoffee.com/muqwishi
► Website muqwishi.com/home/quotation/
► Telegram t.me/MUQWISHI
► Email service@muqwishi.com
⛾ Support My Work on “Buy Me a Coffee” buymeacoffee.com/muqwishi
免責聲明
這些資訊和出版物並非旨在提供,也不構成TradingView提供或認可的任何形式的財務、投資、交易或其他類型的建議或推薦。請閱讀使用條款以了解更多資訊。
開源腳本
秉持TradingView一貫精神,這個腳本的創作者將其設為開源,以便交易者檢視並驗證其功能。向作者致敬!您可以免費使用此腳本,但請注意,重新發佈代碼需遵守我們的社群規範。
Trusted Pine Programmer, For Coding Inquiries
► Website muqwishi.com/home/quotation/
► Telegram t.me/MUQWISHI
► Email service@muqwishi.com
⛾ Support My Work on “Buy Me a Coffee” buymeacoffee.com/muqwishi
► Website muqwishi.com/home/quotation/
► Telegram t.me/MUQWISHI
► Email service@muqwishi.com
⛾ Support My Work on “Buy Me a Coffee” buymeacoffee.com/muqwishi
免責聲明
這些資訊和出版物並非旨在提供,也不構成TradingView提供或認可的任何形式的財務、投資、交易或其他類型的建議或推薦。請閱讀使用條款以了解更多資訊。