OPEN-SOURCE SCRIPT
open close time trend
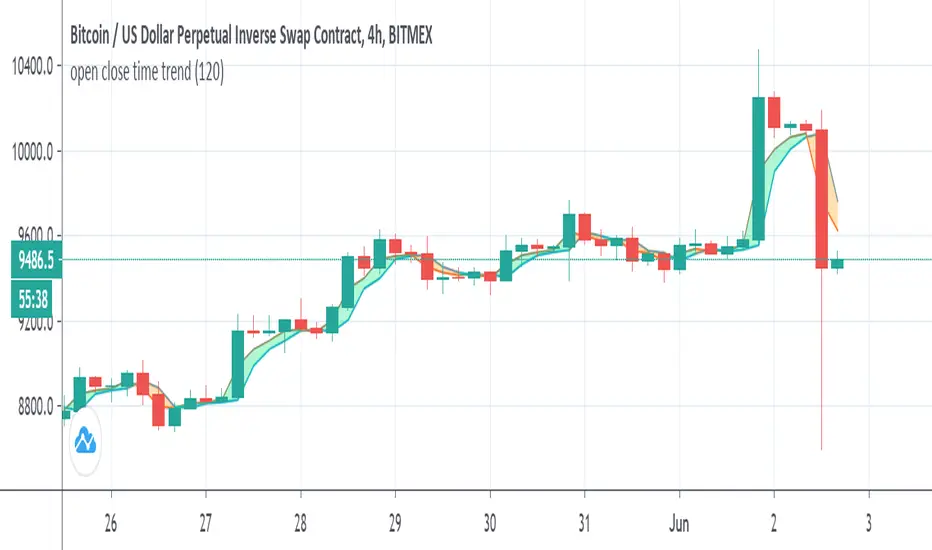
So this indicator show the relation between open and close acording to time length
why it intresting? since the distance is realtion of min compare to the regular way we calculate the distance. in this way we can see how open and close state are related. in this indicator when close above open it buy signal seen as lime and vice versa seen as orange. since the distance is in min we can set the min to be above the chart that we use or to see the distance in min bellow the chart time frame that we use . as in this example it set to 120 min on 4 hour chart. you can go even lower to 60 min on 4 hour chart . this reduce the lag that normaly we have with our indicator. on the other hand we can set it above the time frame that we use in order to see longer trend.
i put signal as options for the crossing of the close and open
there is no repaint here
開源腳本
秉持TradingView一貫精神,這個腳本的創作者將其設為開源,以便交易者檢視並驗證其功能。向作者致敬!您可以免費使用此腳本,但請注意,重新發佈代碼需遵守我們的社群規範。
免責聲明
這些資訊和出版物並非旨在提供,也不構成TradingView提供或認可的任何形式的財務、投資、交易或其他類型的建議或推薦。請閱讀使用條款以了解更多資訊。
開源腳本
秉持TradingView一貫精神,這個腳本的創作者將其設為開源,以便交易者檢視並驗證其功能。向作者致敬!您可以免費使用此腳本,但請注意,重新發佈代碼需遵守我們的社群規範。
免責聲明
這些資訊和出版物並非旨在提供,也不構成TradingView提供或認可的任何形式的財務、投資、交易或其他類型的建議或推薦。請閱讀使用條款以了解更多資訊。