OPEN-SOURCE SCRIPT
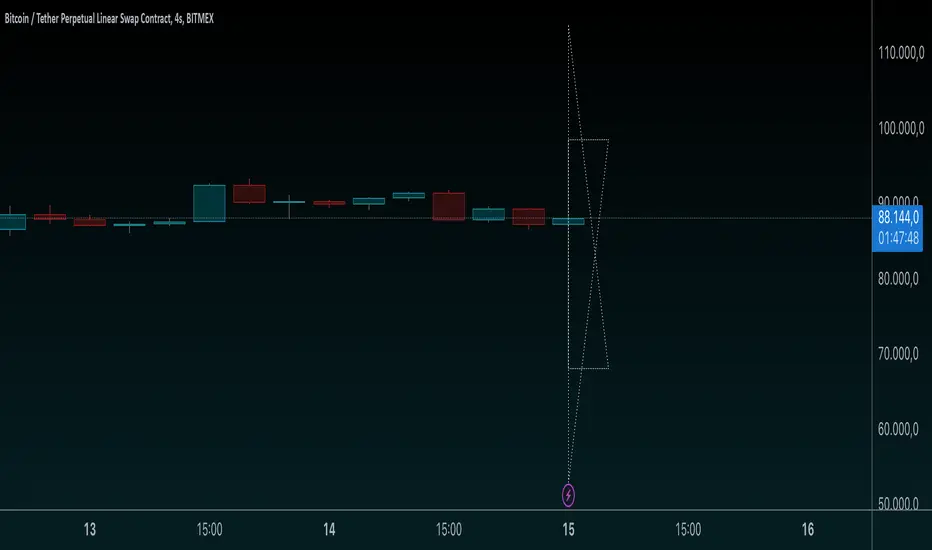
Star of David Drawing-AYNET
Explanation of Code
Settings:
centerTime defines the center time for the star pattern, defaulting to January 1, 2023.
centerPrice is the center Y-axis level for positioning the star.
size controls the overall size of the star.
starColor and lineWidth allow customization of the color and thickness of the lines.
Utility Function:
toRadians converts degrees to radians, though it’s not directly used here, it might be useful for future adjustments to angles.
Star of David Drawing Function:
The drawStarOfDavid function calculates the position of each point on the star relative to the center coordinates (centerTime, centerY) and size.
The pattern has six key points that form two overlapping triangles, creating the Star of David pattern.
The time offsets (offset1 and offset2) determine the horizontal spread of the star, scaling according to size.
The line.new function is used to draw the star lines with the calculated coordinates, casting timestamps to int to comply with line.new requirements.
Star Rendering:
Finally, drawStarOfDavid is called to render the Star of David pattern on the chart based on the input parameters.
This code draws the Star of David on a chart at a specified time and price level, with customizable size, color, and line width. Adjust centerTime, centerPrice, and size as needed for different star placements on the chart.
開源腳本
秉持TradingView一貫精神,這個腳本的創作者將其設為開源,以便交易者檢視並驗證其功能。向作者致敬!您可以免費使用此腳本,但請注意,重新發佈代碼需遵守我們的社群規範。
免責聲明
這些資訊和出版物並非旨在提供,也不構成TradingView提供或認可的任何形式的財務、投資、交易或其他類型的建議或推薦。請閱讀使用條款以了解更多資訊。
開源腳本
秉持TradingView一貫精神,這個腳本的創作者將其設為開源,以便交易者檢視並驗證其功能。向作者致敬!您可以免費使用此腳本,但請注意,重新發佈代碼需遵守我們的社群規範。
免責聲明
這些資訊和出版物並非旨在提供,也不構成TradingView提供或認可的任何形式的財務、投資、交易或其他類型的建議或推薦。請閱讀使用條款以了解更多資訊。