PROTECTED SOURCE SCRIPT
Bitcoin: Value Days Destroyed (VDD) Multiple
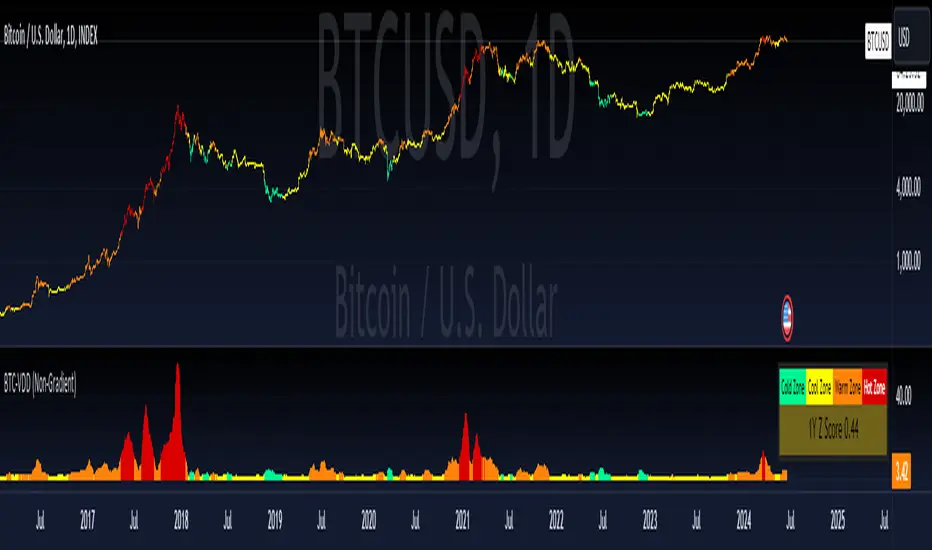
This indicator helps visualize Bitcoin market conditions by categorizing them into four heat zones: Cold, Cool, Warm, and Hot. It uses data from Bitcoin prices and trading volumes to determine these zones.
Key Concepts:
Heat Zones:
Data Sources:
Table: Displays a legend of the heat zones and the z score of 1 year.
Key Concepts:
Heat Zones:
- Cold Zone: Market is very cold.
- Cool Zone: Market is cool.
- Warm Zone: Market is warming up.
- Hot Zone: Market is very hot.
Data Sources:
- Bitcoin Prices: High and low prices.
- Market Capitalization: Realized market cap of Bitcoin.
- Trading Volume: Total volume of Bitcoin transferred.
Table: Displays a legend of the heat zones and the z score of 1 year.
受保護腳本
此腳本以閉源形式發佈。 不過,您可以自由使用,沒有任何限制 — 點擊此處了解更多。
🔍 Access Investing Strategies & Indicators
📊 whop.com/marktquant
🌐 marktquant.com
Nothing shared on this page constitutes financial advice. All information, tools, and analyses are provided solely for informational and educational purposes.
📊 whop.com/marktquant
🌐 marktquant.com
Nothing shared on this page constitutes financial advice. All information, tools, and analyses are provided solely for informational and educational purposes.
免責聲明
這些資訊和出版物並非旨在提供,也不構成TradingView提供或認可的任何形式的財務、投資、交易或其他類型的建議或推薦。請閱讀使用條款以了解更多資訊。