OPEN-SOURCE SCRIPT
PA ScratchiCloud
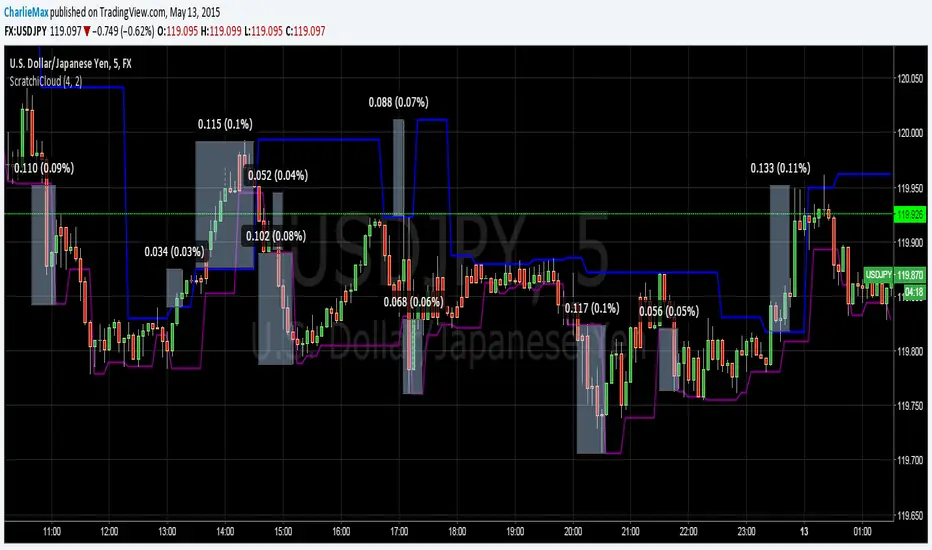
This indicator is a modification of Golgistain's Hi/Lo Pivot indicator. I added a shorter length 2 to get early entries on short positions.
The way it works is you choose a timeframe you would like to trade and then set the indicator length to match the candle price action patterns. Default is M5 chart with 4/2 for the indicators.
Rules: Take the trade when price breaks out the top or bottom of the line.
Exit: Take what you can get and give nothing back.
Good luck - CharlieMax :0)
開源腳本
秉持TradingView一貫精神,這個腳本的創作者將其設為開源,以便交易者檢視並驗證其功能。向作者致敬!您可以免費使用此腳本,但請注意,重新發佈代碼需遵守我們的社群規範。
免責聲明
這些資訊和出版物並非旨在提供,也不構成TradingView提供或認可的任何形式的財務、投資、交易或其他類型的建議或推薦。請閱讀使用條款以了解更多資訊。
免責聲明
這些資訊和出版物並非旨在提供,也不構成TradingView提供或認可的任何形式的財務、投資、交易或其他類型的建議或推薦。請閱讀使用條款以了解更多資訊。