PROTECTED SOURCE SCRIPT
HMA High/Low Band - Trend Color
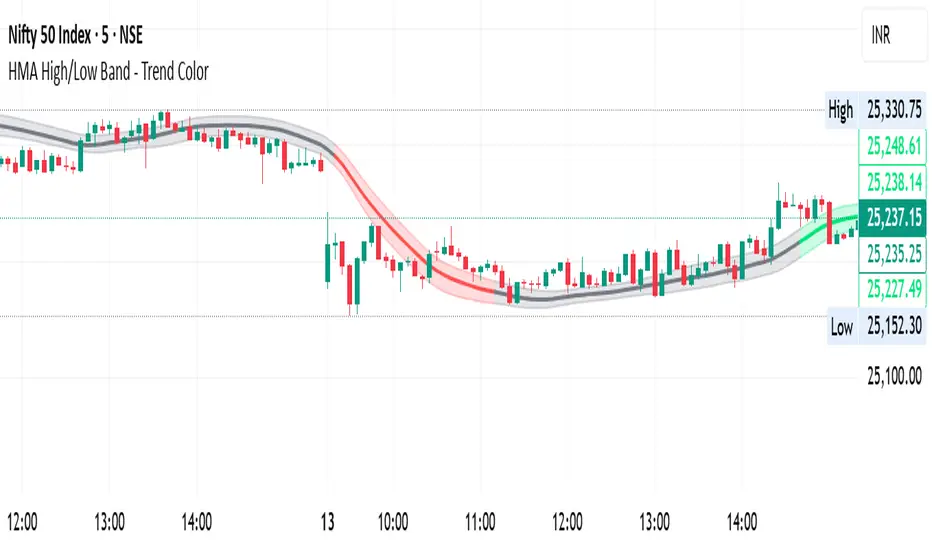
HMA High/Low Band Trend
Visualize market trends clearly with a single Hull Moving Average (HMA) and dynamic high/low bands. The indicator colors the HMA and its bands based on trend direction:
Green = Uptrend
Red = Downtrend
Gray = Sideways
The band adjusts dynamically to price action, giving a clear view of trending and sideways markets without cluttering your chart. Ideal for traders who want a smooth trend filter with instant visual cues.
受保護腳本
此腳本以閉源形式發佈。 不過,您可以自由且不受任何限制地使用它 — 在此處了解更多資訊。
免責聲明
這些資訊和出版物並不意味著也不構成TradingView提供或認可的金融、投資、交易或其他類型的意見或建議。請在使用條款閱讀更多資訊。
受保護腳本
此腳本以閉源形式發佈。 不過,您可以自由且不受任何限制地使用它 — 在此處了解更多資訊。
免責聲明
這些資訊和出版物並不意味著也不構成TradingView提供或認可的金融、投資、交易或其他類型的意見或建議。請在使用條款閱讀更多資訊。