INVITE-ONLY SCRIPT
已更新 PSP Table [Pogiest]
General
Precision Swing Point (PSP) is a concept derived from Quarterly Theory concepts originating from ICT methodologies. The concept typically uses a 3-candle swing formation in which candle 2 has a divergence in the closing price with one asset compared to the other two assets in a correlated asset triad (i.e. one closes bullish and two closes bearish, vice-versa). The indicator is designed to track PSPs in real time as they are forming.
Note: Credit of concepts/ideas goes to TraderDaye.
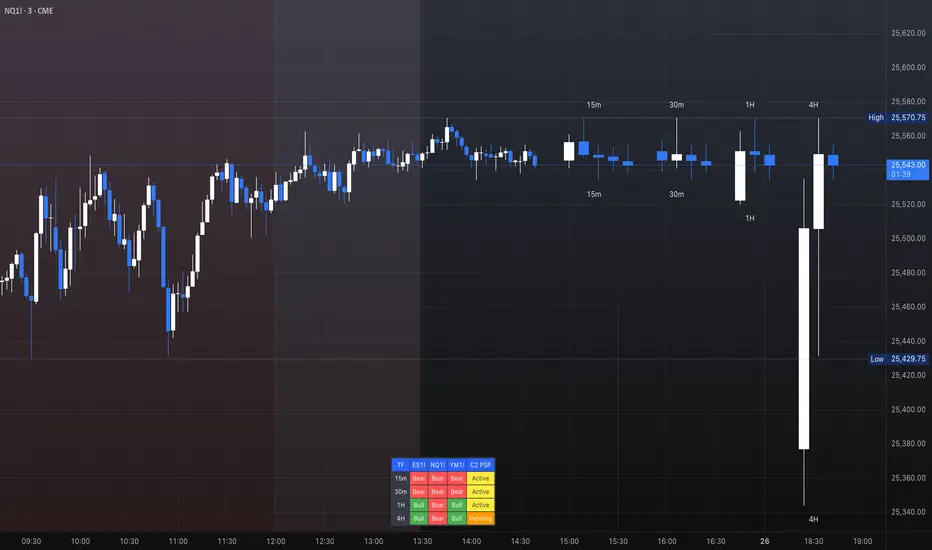
In the image above, the higher timeframe candle overlay is displayed on the chart to be shown as an example with the indicator (table). Higher timeframe candles are not included as part of the indicator. This indicator is only comprised of the table shown.
Timeframe Column:
1. Displays up to four different timeframes to monitor.
Asset Columns:
1. Cells display “Bull” or “Bear” showing the current state of each candle and updates in real-time tick by tick.
C2 PSP Column:
1. “Inactive” indicates no divergence in all assets (i.e. all three assets in a triad are all printing bullish or bearish candles)
2. “Pending” indicates a potential divergence in candle 2’s closing price (i.e. one asset’s current state in candle 2 is bearish while the others are bullish, vice versa). This updates in real-time tick by tick and continues to monitor each candle as they form for a candle 2 divergence.
3. “Active” indicates a confirmed candle 2 divergence.
Note: Any historical PSPs will not be displayed in the table as this indicator only tracks PSPs in real time and continuously monitors for potential PSPs and confirmed PSPs.
Settings
1. Choose up to three different assets to monitor.
Note: If only two are selected, the indicator will only display the two selected and compare the two assets for divergences. If one is selected, a warning sign will be displayed to select at least two assets.
2. Choose up to four different timeframes. Option to deselect timeframes.
3. Toggle option to show/hide the table.
4. Adjust the table positioning to be displayed on the chart.
6. Option to change text size in the table cells. This will also increase/decrease the size of the table.
7. Table Color Customization gives you options to change the background colors of the cells including text color.
What makes this indicator unique:
1. Track current PSP status in real-time tick by tick as candles form in multiple timeframes.
2. Instead of switching through timeframes to check for PSPs, they are consolidated in one table.
Risk Disclaimer
This indicator is for educational and informational purposes only and does not constitute financial advice. All trading and investment decisions remain solely the responsibility of the user.
Trading involves a high degree of risk, and past performance is not indicative of future results.
Always conduct your own research and consult with a qualified financial professional before making any trading decisions.
By using this indicator, users acknowledge they understand these risks and accept full responsibility for their trading decisions and outcomes.
Precision Swing Point (PSP) is a concept derived from Quarterly Theory concepts originating from ICT methodologies. The concept typically uses a 3-candle swing formation in which candle 2 has a divergence in the closing price with one asset compared to the other two assets in a correlated asset triad (i.e. one closes bullish and two closes bearish, vice-versa). The indicator is designed to track PSPs in real time as they are forming.
Note: Credit of concepts/ideas goes to TraderDaye.
In the image above, the higher timeframe candle overlay is displayed on the chart to be shown as an example with the indicator (table). Higher timeframe candles are not included as part of the indicator. This indicator is only comprised of the table shown.
Timeframe Column:
1. Displays up to four different timeframes to monitor.
Asset Columns:
1. Cells display “Bull” or “Bear” showing the current state of each candle and updates in real-time tick by tick.
C2 PSP Column:
1. “Inactive” indicates no divergence in all assets (i.e. all three assets in a triad are all printing bullish or bearish candles)
2. “Pending” indicates a potential divergence in candle 2’s closing price (i.e. one asset’s current state in candle 2 is bearish while the others are bullish, vice versa). This updates in real-time tick by tick and continues to monitor each candle as they form for a candle 2 divergence.
3. “Active” indicates a confirmed candle 2 divergence.
Note: Any historical PSPs will not be displayed in the table as this indicator only tracks PSPs in real time and continuously monitors for potential PSPs and confirmed PSPs.
Settings
1. Choose up to three different assets to monitor.
Note: If only two are selected, the indicator will only display the two selected and compare the two assets for divergences. If one is selected, a warning sign will be displayed to select at least two assets.
2. Choose up to four different timeframes. Option to deselect timeframes.
3. Toggle option to show/hide the table.
4. Adjust the table positioning to be displayed on the chart.
6. Option to change text size in the table cells. This will also increase/decrease the size of the table.
7. Table Color Customization gives you options to change the background colors of the cells including text color.
What makes this indicator unique:
1. Track current PSP status in real-time tick by tick as candles form in multiple timeframes.
2. Instead of switching through timeframes to check for PSPs, they are consolidated in one table.
Risk Disclaimer
This indicator is for educational and informational purposes only and does not constitute financial advice. All trading and investment decisions remain solely the responsibility of the user.
Trading involves a high degree of risk, and past performance is not indicative of future results.
Always conduct your own research and consult with a qualified financial professional before making any trading decisions.
By using this indicator, users acknowledge they understand these risks and accept full responsibility for their trading decisions and outcomes.
發行說明
Naming Correction.僅限邀請腳本
只有經作者批准的使用者才能訪問此腳本。您需要申請並獲得使用權限。該權限通常在付款後授予。如欲了解更多詳情,請依照以下作者的說明操作,或直接聯絡Pogiest。
除非您完全信任其作者並了解腳本的工作原理,否則TradingView不建議您付費或使用腳本。您也可以在我們的社群腳本中找到免費的開源替代方案。
作者的說明
To get access, please visit website: https://whop.com/pogiest-c457 or https://whop.com/pogiest-c457/precision-swing-point-table
For further questions regarding the functions of the indicator, feel free to message me directly here on TradingView. - Pogiest
免責聲明
這些資訊和出版物並不意味著也不構成TradingView提供或認可的金融、投資、交易或其他類型的意見或建議。請在使用條款閱讀更多資訊。
僅限邀請腳本
只有經作者批准的使用者才能訪問此腳本。您需要申請並獲得使用權限。該權限通常在付款後授予。如欲了解更多詳情,請依照以下作者的說明操作,或直接聯絡Pogiest。
除非您完全信任其作者並了解腳本的工作原理,否則TradingView不建議您付費或使用腳本。您也可以在我們的社群腳本中找到免費的開源替代方案。
作者的說明
To get access, please visit website: https://whop.com/pogiest-c457 or https://whop.com/pogiest-c457/precision-swing-point-table
For further questions regarding the functions of the indicator, feel free to message me directly here on TradingView. - Pogiest
免責聲明
這些資訊和出版物並不意味著也不構成TradingView提供或認可的金融、投資、交易或其他類型的意見或建議。請在使用條款閱讀更多資訊。