INVITE-ONLY SCRIPT
已更新 Enhanced Autocorrelation Periodogram RasterChart - Ehlers
Firstly, this is NOT an indicator. It's an advanced cycle period detector for advanced developers OR scripts providing a "Period Source" they may have developed that can utilize this detector. Be forewarned! I would only recommend this for advanced developers, not novice. If you are up to the challenge of manually altering period adjustments on the daily chart of an indicator by hand in real time, you may still obtain this indicator after negotiating a proper request for access, but I will say this, it is NOT suitable for all indicators.
Understand all of the above aforementioned? Proceed...
For those of you wondering how I did it without Pine support for arrays, I had to emulate them, totaling over 600+ lines of code. This was a formidable task to achieve. This may be the hardest task I have ever accomplished, as of yet, in Pine.
Now, on to the Description...
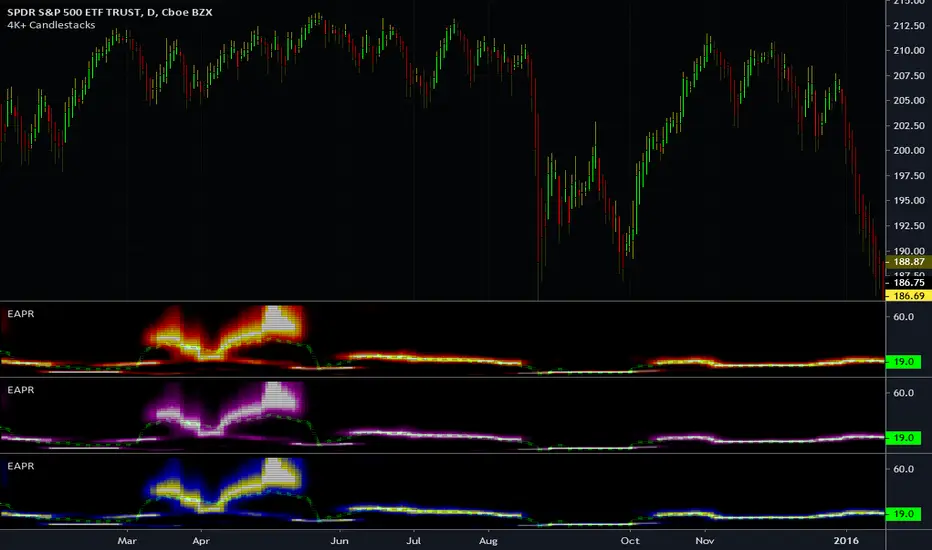
This is my enhanced and heavily* modified version of Dr. John Ehlers' autocorellation periodogram for detecting dominant cycles(frequencies) in an asset using Pine Script version 4.0. The original concept comes from chapter 8 of his book "Cycle Analytics for Traders" and may also be found in TASC magazine in the September 2016 issue. I did heavily modify the original computations for the purpose of providing the "maximum" amount of adjustability there is to possibly offer, but left the original settings intact. I also provided an assortment of vibrant color changing techniques to choose from for anyone who may have vision impairments. This also displays that color scheming is VERY possible in Pine ...if only I could get "chart.theme" for auto-detection.
I once again would personally like to thank the talented individuals at TV for providing a platform that embraces an initial free membership, which I first obtained myself, for individuals like me to freely code in Pine with mathemagical ideas and mental wizardry, creating ultimately, inventions like this eye candy display above.
Features List Includes:
"Source" Selection
Color schemes (displayed above)
Transparency for the heat map to reduce or intensify color brightness ( Thank you TV! For this feature...)
The detected dominant cycle can be 'Sourced' by another specially** modified script providing an integer, float, or a rounded float.
Resolution enhancement has 3 settings
Smoother period control
Highpass period control
Pearson correlation period control
Minimal Power Threshold Tweak(Experimental***)
Adjustment for the smoothing coefficients of the Fourier Transforms(Experimental!)
This is not a freely available indicator, FYI. To witness my Pine poetry in action, properly negotiated requests for unlimited access, per indicator, may ONLY be obtained by direct contact with me using TV's "Private Chats" or by "Message" in my member name above. The comments section below is solely just for commenting and other remarks, ideas, compliments, etc... If you do have any questions or comments regarding this indicator, I will consider your inquiries, thoughts, and ideas presented below in the comments section, when time provides it. As always, "Like" it if you simply just like it, and also return to my scripts list occasionally for additional postings. Have a profitable future everyone!
* This has additional features/tweaks not included in the original.
** Many Pine built-in functions WILL NOT support the use of this detector if 'Sourced' to control a period setting. You have to totally rewrite those built-in Pine functions in Pine script. Yes, it is very possible! BUT ...in many cases, not all.
*** This "modification" reduces large spikes in the detected dominant cycle period with increased adjustment. Increasing this value may reduce dominant cycle spikes around 0.3-ish
Understand all of the above aforementioned? Proceed...
For those of you wondering how I did it without Pine support for arrays, I had to emulate them, totaling over 600+ lines of code. This was a formidable task to achieve. This may be the hardest task I have ever accomplished, as of yet, in Pine.
Now, on to the Description...
This is my enhanced and heavily* modified version of Dr. John Ehlers' autocorellation periodogram for detecting dominant cycles(frequencies) in an asset using Pine Script version 4.0. The original concept comes from chapter 8 of his book "Cycle Analytics for Traders" and may also be found in TASC magazine in the September 2016 issue. I did heavily modify the original computations for the purpose of providing the "maximum" amount of adjustability there is to possibly offer, but left the original settings intact. I also provided an assortment of vibrant color changing techniques to choose from for anyone who may have vision impairments. This also displays that color scheming is VERY possible in Pine ...if only I could get "chart.theme" for auto-detection.
I once again would personally like to thank the talented individuals at TV for providing a platform that embraces an initial free membership, which I first obtained myself, for individuals like me to freely code in Pine with mathemagical ideas and mental wizardry, creating ultimately, inventions like this eye candy display above.
Features List Includes:
"Source" Selection
Color schemes (displayed above)
Transparency for the heat map to reduce or intensify color brightness ( Thank you TV! For this feature...)
The detected dominant cycle can be 'Sourced' by another specially** modified script providing an integer, float, or a rounded float.
Resolution enhancement has 3 settings
Smoother period control
Highpass period control
Pearson correlation period control
Minimal Power Threshold Tweak(Experimental***)
Adjustment for the smoothing coefficients of the Fourier Transforms(Experimental!)
This is not a freely available indicator, FYI. To witness my Pine poetry in action, properly negotiated requests for unlimited access, per indicator, may ONLY be obtained by direct contact with me using TV's "Private Chats" or by "Message" in my member name above. The comments section below is solely just for commenting and other remarks, ideas, compliments, etc... If you do have any questions or comments regarding this indicator, I will consider your inquiries, thoughts, and ideas presented below in the comments section, when time provides it. As always, "Like" it if you simply just like it, and also return to my scripts list occasionally for additional postings. Have a profitable future everyone!
* This has additional features/tweaks not included in the original.
** Many Pine built-in functions WILL NOT support the use of this detector if 'Sourced' to control a period setting. You have to totally rewrite those built-in Pine functions in Pine script. Yes, it is very possible! BUT ...in many cases, not all.
*** This "modification" reduces large spikes in the detected dominant cycle period with increased adjustment. Increasing this value may reduce dominant cycle spikes around 0.3-ish
發行說明
Added "title=DomCycle" to the dominant cycle plot for ease of finding EAPR: DomCycle when using sourceDC = max(2, min(100, input(close, "Dominant Cycle Source", input.source"))) to tether a separate custom indicator dynamically to this detector. CCI may use the dominant cycle integer as is, but most other functions/indicators may use sourceDC * 0.5 . MACD may use {sourceDC * 0.5, sourceDC} replacing {12, 26}. Being the period is approximately half of the dominant cycle, the period/length of a calculation is usually around half of the sourceDC+/- to provide an optimal tweaked setting. So, effectively you may use (sourceDC * 0.5) + offsetPeriod if offsetPeriod is defined as such: offsetPeriod = input(0, "Period Offset", input.integer) . Within the custom functions using DomCycle as a float, you may have to use int() especially when encountering a for loop. I hope I explained that properly...發行說明
Color ImprovementsRefactored/optimized code improving efficiency
Added additional smoothing algorithm for the Fourier transforms
Cleaned up Settings
僅限邀請腳本
只有經作者授權的使用者才能訪問此腳本,且通常需付費。您可以將此腳本加入收藏,但需先向作者申請並獲得許可後才能使用 — 點擊此處了解更多。如需更多詳情,請依照作者說明或直接聯繫ImmortalFreedom。
除非您完全信任其作者並了解腳本的工作原理,否則TradingView不建議您付費或使用腳本。您也可以在我們的社群腳本中找到免費的開源替代方案。
作者的說明
提醒:在請求訪問權限之前,請閱讀僅限邀請腳本指南。
免責聲明
這些資訊和出版物並不意味著也不構成TradingView提供或認可的金融、投資、交易或其他類型的意見或建議。請在使用條款閱讀更多資訊。
僅限邀請腳本
只有經作者授權的使用者才能訪問此腳本,且通常需付費。您可以將此腳本加入收藏,但需先向作者申請並獲得許可後才能使用 — 點擊此處了解更多。如需更多詳情,請依照作者說明或直接聯繫ImmortalFreedom。
除非您完全信任其作者並了解腳本的工作原理,否則TradingView不建議您付費或使用腳本。您也可以在我們的社群腳本中找到免費的開源替代方案。
作者的說明
提醒:在請求訪問權限之前,請閱讀僅限邀請腳本指南。
免責聲明
這些資訊和出版物並不意味著也不構成TradingView提供或認可的金融、投資、交易或其他類型的意見或建議。請在使用條款閱讀更多資訊。