PROTECTED SOURCE SCRIPT
已更新 [JHF] SQZMOMPRO
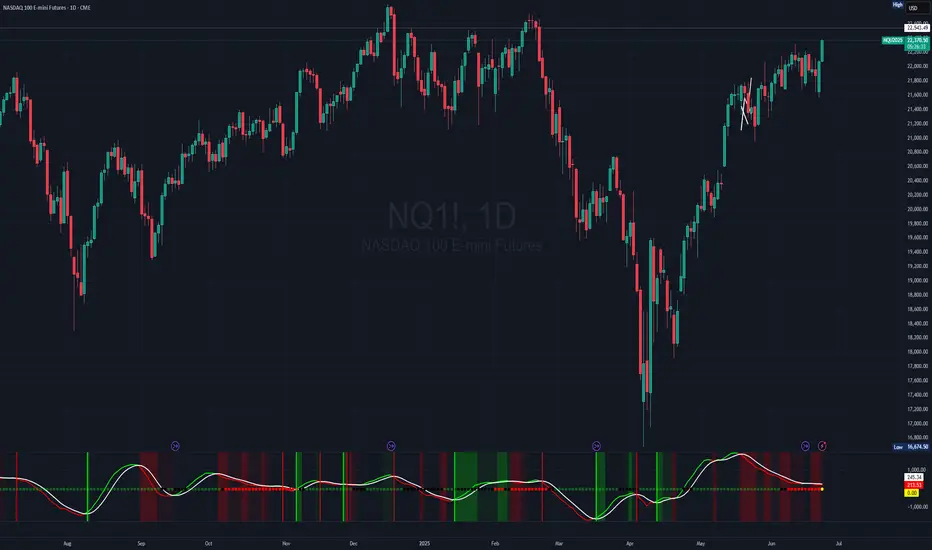
[JHF] SQZMOMPRO is a sophisticated, momentum-based technical indicator designed for traders seeking to identify potential trend reversals, momentum shifts, and periods of market consolidation (squeezes) across multiple timeframes. By combining a momentum oscillator, Bollinger Bands, Keltner Channels, and a Percentage Volume Oscillator (PVO), it provides a comprehensive view of price momentum and volume dynamics.
Overview
The [JHF] SQZMOMPRO indicator is a powerful tool that integrates momentum analysis, volatility-based squeeze detection, and volume confirmation to help traders identify high-probability trading opportunities. It combines:
A momentum oscillator based on price deviations from a linear regression and moving average.
Bollinger Bands and Keltner Channels to detect periods of low volatility (squeezes), signaling potential breakouts.
A Percentage Volume Oscillator (PVO) to confirm momentum signals with volume trends.
A Rate of Change (ROC) line to highlight the speed of momentum shifts.
Visual cues like reversal signals and confluence backgrounds for actionable insights.
This indicator is ideal for swing traders, day traders, and those analyzing trends across multiple timeframes (hourly, 4-hour, daily, weekly, monthly). It is plotted below the price chart (non-overlay) and includes customizable alerts for key conditions.
Key Features
Multi-Timeframe Support: Automatically adjusts parameters for hourly, 4-hour, daily, weekly, and monthly charts, ensuring optimal settings for each timeframe.
Squeeze Detection: Identifies periods of low volatility (squeezes) using Bollinger Bands and Keltner Channels, categorized as Wide, Normal, Narrow, or Very Narrow.
Momentum Oscillator: Tracks price momentum relative to a baseline, with a signal line to highlight trend reversals.
PVO Confluence: Optionally integrates the Percentage Volume Oscillator to confirm momentum signals with volume trends.
Rate of Change (ROC): Displays the smoothed rate of change of momentum for enhanced readability.
Visual Cues: Includes color-coded squeeze dots, momentum/signal lines, reversal markers, and optional confluence backgrounds.
Alerts: Configurable alerts for squeeze conditions, trend reversals, and volume-confirmed signals.
How It Works
1. Momentum Oscillator
The momentum oscillator is calculated as follows:
Source: Closing price.
Baseline: A combination of the midpoint of the highest high and lowest low over a specified period, adjusted by a simple moving average (SMA).
Momentum: Linear regression of the price deviation from this baseline over a timeframe-specific period (shorter for smaller timeframes to be more responsive).
Signal Line: A 5-period SMA of the momentum value, used to identify crossovers.
Interpretation:
Momentum > Signal: Bullish momentum (plotted in green by default).
Momentum < Signal: Bearish momentum (plotted in red by default).
Crossovers: Momentum crossing above the signal line suggests a bullish reversal; crossing below suggests a bearish reversal.
2. Squeeze Detection
Squeezes occur when volatility contracts, often preceding significant price moves. The indicator compares:
Bollinger Bands: Calculated using an SMA and 2 standard deviations of the closing price.
Keltner Channels: Calculated using an SMA and multiples of the Average True Range (ATR) for different squeeze thresholds (Wide, Normal, Narrow, Very Narrow). This method steers away from the likes of classical SQZPRO which only uses an approximation of the Average True Range and heavily affects the squeeze sensitivity due to the way they calculate their Keltner Channel (our Keltner Channel are true to the way they are supposed to be calculated).
Squeeze Conditions:
Wide Squeeze: Bollinger Bands are inside Keltner Channels with a high ATR multiplier.
Normal Squeeze: Bollinger Bands are inside Keltner Channels with a moderate ATR multiplier.
Narrow Squeeze: Bollinger Bands are inside Keltner Channels with a low ATR multiplier.
Very Narrow Squeeze: Bollinger Bands are inside Keltner Channels with a very low ATR.
No Squeeze: Bollinger Bands are outside Keltner Channels, indicating higher volatility.
Depending on the timeframe, each squeeze level has been manually tweaked to gain an edge, whether you're scalping, in swings or in Leaps.
Visuals: Squeeze conditions are plotted as colored dots on the zero line:
Green: No Squeeze
Black: Wide Squeeze
Red: Normal Squeeze
Yellow: Narrow Squeeze
Purple: Very Narrow Squeeze
3. Percentage Volume Oscillator (PVO)
The PVO measures volume momentum, similar to the MACD but applied to volume through a 14 and 28 ema with volume as the srouce.
Interpretation:
PVO > 0: Increasing volume momentum (bullish).
PVO < 0: Decreasing volume momentum (bearish).
When enabled (Show PVO Confluence), the indicator highlights periods where momentum and PVO align (e.g., bullish momentum with PVO > 0).
4. Rate of Change (ROC)
Formula: Smoothed difference between momentum and signal line, multiplied by a user-defined factor (ROC Multiplier).
Purpose: Enhances readability of momentum shifts, plotted as a blue (positive) or orange (negative) line when enabled.
5. Reversal Signals
Bullish Reversal: Momentum crosses above the signal line, optionally confirmed by PVO > 0. Marked with a green vertical line.
Bearish Reversal: Momentum crosses below the signal line, optionally confirmed by PVO < 0. Marked with a red vertical line.
6. Confluence Background
When Show PVO Confluence is enabled, the background is colored to highlight alignment:
Bullish Confluence: Momentum > Signal and PVO > 0 (green background, darker if ROC is positive).
Bearish Confluence: Momentum < Signal and PVO < 0 (red background, darker if ROC is negative).
Inputs
Basic Configuration:
Display Reversals: Show/hide reversal markers for momentum/signal crossovers (default: true).
Show PVO Confluence: Enable/disable background coloring for momentum and PVO alignment (default: false).
Rate of Change:
Show Rate of Change Line: Display the ROC line (default: false).
ROC Smoothing Length: Smoothing period for ROC (default: 1, min: 1).
ROC Multiplier: Scales ROC for readability (default: 1, min: 1).
Plotline Colors:
Bullish Momentum: Green (default: RGB(0, 255, 0)).
Bearish Momentum: Red (default: RGB(255, 0, 0)).
Signal Line: White (default: RGB(255, 255, 255)).
Squeeze Colors:
No Squeeze: Green.
Wide Squeeze: Black.
Normal Squeeze: Red.
Narrow Squeeze: Yellow.
Very Narrow Squeeze: Purple.
Timeframe-Specific Parameters
The indicator adapts to the chart’s timeframe, using predefined settings.
Hourly, 4-Hour, Daily, Weekly and Monthly (and everything in between) all have custom, tweaked momentum length, ATR length, and squeeze multiplier threshold to suit the sensitivity needed for the current timeframe.
Trading Applications
Squeeze Breakouts:
A transition from a Very Narrow or Narrow Squeeze to No Squeeze often signals a breakout. Combine with momentum crossovers for confirmation.
Example: Enter a long position when a Narrow Squeeze (yellow dots) turns to No Squeeze (green dots) and momentum crosses above the signal line.
Trend Reversals:
Bullish reversal (green line) with PVO > 0 confirms strong buying volume, increasing the likelihood of a sustained uptrend.
Bearish reversal (red line) with PVO < 0 suggests strong selling pressure.
Confluence Trading:
Use confluence backgrounds to trade only when momentum and volume align, reducing false signals.
Example: A bullish confluence (green background) with positive ROC indicates a high-probability long setup.
Divergences:
Look for divergences between price and momentum or PVO. For instance, a higher low in momentum/PVO with a lower low in price suggests a bullish reversal.
Trend Confirmation:
Use the momentum oscillator and ROC to confirm price trends. A rising momentum and positive ROC validate an uptrend.
Alerts
Squeeze Alerts:
🟢 No Squeeze: Volatility is expanding.
⚫ Low Squeeze: Wide squeeze detected.
🔴 Normal Squeeze: Moderate squeeze detected.
🟡 Tight Squeeze: Narrow squeeze detected.
🟣 Very Tight Squeeze: Very narrow squeeze detected.
Reversal Alerts:
🐂 Bullish Trend Reversal: Momentum crosses above signal.
🐻 Bearish Trend Reversal: Momentum crosses below signal.
🐂 Bullish Trend Reversal + 📊 PVO Confluence: Momentum crossover with PVO > 0.
🐻 Bearish Trend Reversal + 📊 PVO Confluence: Momentum crossover with PVO < 0.
Limitations
Lagging Nature: The momentum oscillator and PVO rely on moving averages, which may lag sudden price or volume spikes.
False Signals: Squeezes and crossovers can occur in choppy markets, leading to whipsaws. Confirm with price action or other indicators.
Timeframe Sensitivity: Results vary by timeframe; test settings for your trading style (e.g., shorter lengths for day trading).
How to Use
Add to Chart: Apply the indicator to any TradingView chart (non-overlay).
Customize Settings:
Enable Display Reversals for crossover markers.
Enable Show PVO Confluence for volume confirmation.
Adjust ROC Smoothing and ROC Multiplier for clearer ROC visuals.
Customize colors for better visibility.
Interpret Signals:
Monitor squeeze dots for volatility changes.
Watch for momentum/signal crossovers and confluence backgrounds.
Use ROC to gauge momentum strength.
Set Alerts: Configure alerts for squeezes, reversals, or confluence signals to stay informed.
Example Scenario
Setup: A stock in a Very Narrow Squeeze (purple dots) on the daily chart, with momentum below the signal line and PVO < 0.
Signal: Momentum crosses above the signal line, PVO turns positive, and the squeeze transitions to No Squeeze (green dots).
Action: Enter a long position, targeting the next resistance level, with a stop-loss below recent support. The green confluence background and positive ROC confirm the trade.
Conclusion
The [JHF] SQZMOMPRO indicator is a versatile tool for traders seeking to capitalize on momentum, volatility, and volume trends. Its multi-timeframe adaptability, visual clarity, and robust alert system make it suitable for various trading strategies. Combine with price action, support/resistance, or other indicators for optimal results. For feedback or suggestions, feel free to leave a comment.
發行說明
Updated chart.受保護腳本
此腳本以閉源形式發佈。 不過,您可以自由且不受任何限制地使用它 — 在此處了解更多資訊。
The Real World - Stocks Campus:
Stocks, Options, Futures, Forex, Crypto, this is what we trade.
Learn profitable trading systems or build your own, just like I did.
jointherealworld.com/?a=tkbmft8bqf
Stocks, Options, Futures, Forex, Crypto, this is what we trade.
Learn profitable trading systems or build your own, just like I did.
jointherealworld.com/?a=tkbmft8bqf
免責聲明
這些資訊和出版物並不意味著也不構成TradingView提供或認可的金融、投資、交易或其他類型的意見或建議。請在使用條款閱讀更多資訊。
受保護腳本
此腳本以閉源形式發佈。 不過,您可以自由且不受任何限制地使用它 — 在此處了解更多資訊。
The Real World - Stocks Campus:
Stocks, Options, Futures, Forex, Crypto, this is what we trade.
Learn profitable trading systems or build your own, just like I did.
jointherealworld.com/?a=tkbmft8bqf
Stocks, Options, Futures, Forex, Crypto, this is what we trade.
Learn profitable trading systems or build your own, just like I did.
jointherealworld.com/?a=tkbmft8bqf
免責聲明
這些資訊和出版物並不意味著也不構成TradingView提供或認可的金融、投資、交易或其他類型的意見或建議。請在使用條款閱讀更多資訊。