PROTECTED SOURCE SCRIPT
IKODO Harmonic Patterns
IKODO Harmonic Patterns How its Works
IKODO Harmonic Patterns automatically scans your chart to detect Gartley , Bat , Butterfly , and Crab harmonic patterns in real-time, using strict Fibonacci ratio checks with configurable tolerance and pivot lengths.
Pivot Detection
Uses pivot highs/lows with a configurable length to mark potential turning points on the chart.
Stores and updates the last 50 pivots for performance.
Pattern Identification
Continuously checks for XABCD structures:
Confirms alternating pivot highs/lows.
Calculates XA, AB, BC, CD, AD legs.
Validates Fibonacci ratios within your defined tolerance:
Gartley: AB = 0.618 XA, AD = 0.786 XA
Bat: AB = 0.382/0.5 XA, AD = 0.886 XA
Butterfly: AB = 0.786 XA, AD = 1.272/1.618 XA
Crab: AB = 0.382/0.618 XA, AD = 1.618 XA
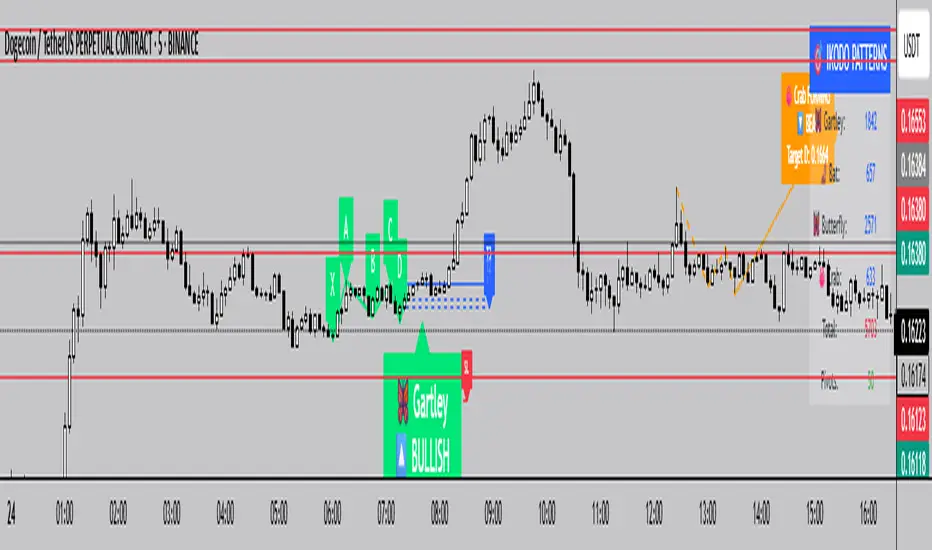
Visualization
Draws XABCD lines and labels on your chart.
Displays entry, three target levels (T1, T2, T3), and a stop-loss suggestion for risk management.
Uses color coding:
Green for bullish patterns.
Red for bearish patterns.
Orange for potential (forming) patterns.
Alerts & Table Stats
Generates alerts when a valid pattern completes.
Displays a live table showing:
Count of each pattern type found.
Total patterns detected.
Number of pivots tracked.
Potential Pattern Projection
If a potential pattern is forming (XAB complete, D pending), the indicator:
Projects the potential D point based on Fibonacci extensions.
Marks the path with dotted/dashed lines.
Displays a label with expected D price and pattern type.
Why Use This?
Automates advanced harmonic detection without manual drawing.
Helps in identifying precise reversal points for high-R/R trades.
Supports visual learning of harmonics while trading.
IKODO Harmonic Patterns automatically scans your chart to detect Gartley , Bat , Butterfly , and Crab harmonic patterns in real-time, using strict Fibonacci ratio checks with configurable tolerance and pivot lengths.
Pivot Detection
Uses pivot highs/lows with a configurable length to mark potential turning points on the chart.
Stores and updates the last 50 pivots for performance.
Pattern Identification
Continuously checks for XABCD structures:
Confirms alternating pivot highs/lows.
Calculates XA, AB, BC, CD, AD legs.
Validates Fibonacci ratios within your defined tolerance:
Gartley: AB = 0.618 XA, AD = 0.786 XA
Bat: AB = 0.382/0.5 XA, AD = 0.886 XA
Butterfly: AB = 0.786 XA, AD = 1.272/1.618 XA
Crab: AB = 0.382/0.618 XA, AD = 1.618 XA
Visualization
Draws XABCD lines and labels on your chart.
Displays entry, three target levels (T1, T2, T3), and a stop-loss suggestion for risk management.
Uses color coding:
Green for bullish patterns.
Red for bearish patterns.
Orange for potential (forming) patterns.
Alerts & Table Stats
Generates alerts when a valid pattern completes.
Displays a live table showing:
Count of each pattern type found.
Total patterns detected.
Number of pivots tracked.
Potential Pattern Projection
If a potential pattern is forming (XAB complete, D pending), the indicator:
Projects the potential D point based on Fibonacci extensions.
Marks the path with dotted/dashed lines.
Displays a label with expected D price and pattern type.
Why Use This?
Automates advanced harmonic detection without manual drawing.
Helps in identifying precise reversal points for high-R/R trades.
Supports visual learning of harmonics while trading.
受保護腳本
此腳本以閉源形式發佈。 不過,您可以自由使用,沒有任何限制 — 點擊此處了解更多。
免責聲明
這些資訊和出版物並非旨在提供,也不構成TradingView提供或認可的任何形式的財務、投資、交易或其他類型的建議或推薦。請閱讀使用條款以了解更多資訊。
免責聲明
這些資訊和出版物並非旨在提供,也不構成TradingView提供或認可的任何形式的財務、投資、交易或其他類型的建議或推薦。請閱讀使用條款以了解更多資訊。