PROTECTED SOURCE SCRIPT
Volatility Barometer (VB)
Volatility Barometer (VB)
The Volatility Barometer (VB) is a comprehensive market sentiment indicator designed to measure aggregate stress and fear in the equity market. It consolidates three critical volatility metrics into a single, easy-to-interpret score, providing a broader view of market conditions than any single metric alone.
Core Components
The barometer synthesizes information from:
VIX Index (VIX): The standard measure of implied 30-day stock market volatility.
VVIX Index (VVIX): The volatility of the VIX itself, often seen as the "volatility of volatility." High VVIX readings can signal uncertainty about the VIX's future path.
VIX Futures Term Structure (VX1!−VX2!): The spread between the front-month and second-month VIX futures. A positive spread (contango) is typical, while a negative spread (backwardation) often signals imminent market stress.
How It Works
To create a unified view, the indicator normalizes each of these three components using a Z-score. The Z-score measures how many standard deviations a value is from its historical mean over a user-defined period (defaulting to 252 days, or one trading year).
These three standardized Z-scores are then combined into a final VB Score using a weighted average. Users can customize these weights in the indicator's settings to emphasize the components they find most important.
How to Interpret
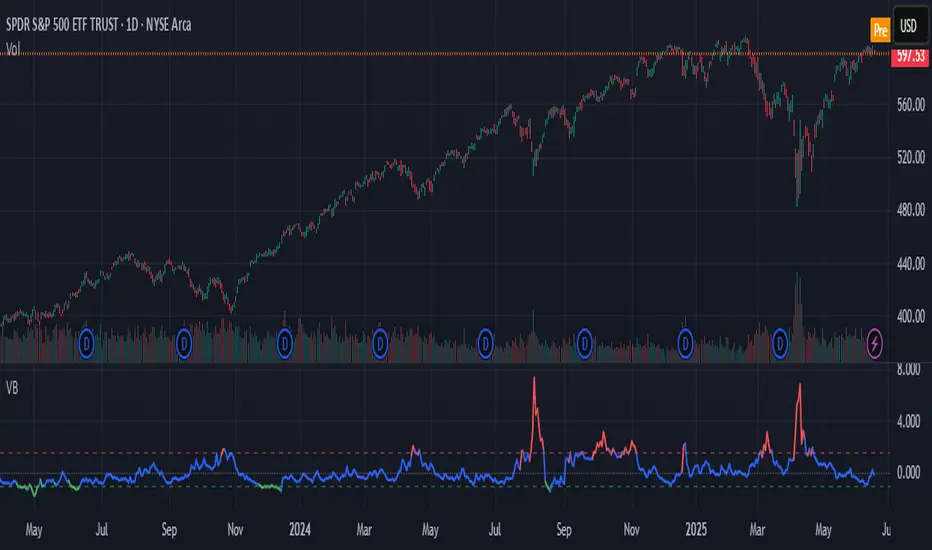
The VB Score is plotted as a single line that oscillates around a zero level, with its color changing to reflect the prevailing market regime:
High Stress (Red Line): When the score rises above the "High stress threshold" (default: 1.5), it indicates heightened market fear and risk-off sentiment. This is a period of significant stress, often associated with market downturns.
Low Stress (Green Line): When the score falls below the "Low stress threshold" (default: -1.0), it signals complacency and low perceived risk in the market. Extreme low readings can sometimes precede volatility spikes.
Neutral (Blue Line): Scores between the high and low thresholds represent normal market conditions.
By providing a weighted, multi-faceted view of volatility, the Volatility Barometer helps traders and investors identify market regimes, confirm trading biases, and anticipate potential shifts in market sentiment.
The Volatility Barometer (VB) is a comprehensive market sentiment indicator designed to measure aggregate stress and fear in the equity market. It consolidates three critical volatility metrics into a single, easy-to-interpret score, providing a broader view of market conditions than any single metric alone.
Core Components
The barometer synthesizes information from:
VIX Index (VIX): The standard measure of implied 30-day stock market volatility.
VVIX Index (VVIX): The volatility of the VIX itself, often seen as the "volatility of volatility." High VVIX readings can signal uncertainty about the VIX's future path.
VIX Futures Term Structure (VX1!−VX2!): The spread between the front-month and second-month VIX futures. A positive spread (contango) is typical, while a negative spread (backwardation) often signals imminent market stress.
How It Works
To create a unified view, the indicator normalizes each of these three components using a Z-score. The Z-score measures how many standard deviations a value is from its historical mean over a user-defined period (defaulting to 252 days, or one trading year).
These three standardized Z-scores are then combined into a final VB Score using a weighted average. Users can customize these weights in the indicator's settings to emphasize the components they find most important.
How to Interpret
The VB Score is plotted as a single line that oscillates around a zero level, with its color changing to reflect the prevailing market regime:
High Stress (Red Line): When the score rises above the "High stress threshold" (default: 1.5), it indicates heightened market fear and risk-off sentiment. This is a period of significant stress, often associated with market downturns.
Low Stress (Green Line): When the score falls below the "Low stress threshold" (default: -1.0), it signals complacency and low perceived risk in the market. Extreme low readings can sometimes precede volatility spikes.
Neutral (Blue Line): Scores between the high and low thresholds represent normal market conditions.
By providing a weighted, multi-faceted view of volatility, the Volatility Barometer helps traders and investors identify market regimes, confirm trading biases, and anticipate potential shifts in market sentiment.
受保護腳本
此腳本以閉源形式發佈。 不過,您可以自由使用,沒有任何限制 — 點擊此處了解更多。
免責聲明
這些資訊和出版物並非旨在提供,也不構成TradingView提供或認可的任何形式的財務、投資、交易或其他類型的建議或推薦。請閱讀使用條款以了解更多資訊。
受保護腳本
此腳本以閉源形式發佈。 不過,您可以自由使用,沒有任何限制 — 點擊此處了解更多。
免責聲明
這些資訊和出版物並非旨在提供,也不構成TradingView提供或認可的任何形式的財務、投資、交易或其他類型的建議或推薦。請閱讀使用條款以了解更多資訊。