INVITE-ONLY SCRIPT
Relative Performance Indicator

Ever since I started with trading, I was interested in the relative performance over a given period of a certain crypto against Bitcoin. This is particularly useful for finding potential winners in trending markets. In bullish markets you want to look for crypto’s that are underperforming against BTC, with the hope that at some point in the near future they will overtake BTC’s growth and see exponential returns.
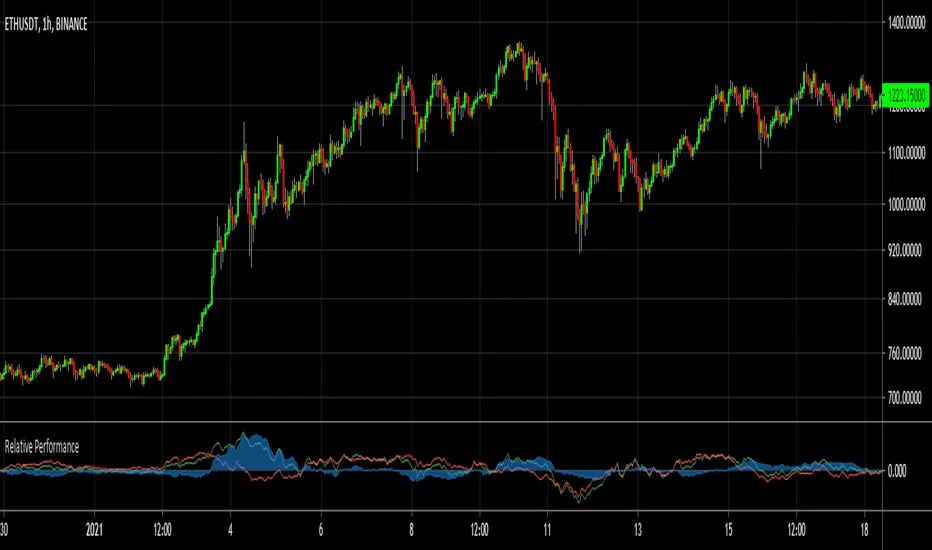
This indicator should not be used on a timeframe lower than 1 hour, else the amount of noise could be distorting your trades. With the standard settings this indicator compares your currently selected asset and compares it against Bitcoin’s performance over a given period.
How to trade: I use this indicator to find crypto’s which could see strong returns in the near future because they are lagging behind (blue area < zero) BTC, and therefore have more ground to make up for. The first pic is a trade which I recently shared on Tradingview using this indicator. ALPHA's returns were weakening compared to Bitcoin’s and was therefore a decent buying opportunity. Also, this indicator is great to find potential tops (or bottoms). When the blue area starts peaking and reversing, it would be a good moment to exit your trade.
It’s not recommended to use this indicator “naked”. Use it to find potential undervalued (or overvalued) assets and adjust your trading plan accordingly.
Select the “Difference Switch” option if you’d want to attach an alert to the study. This alert will trigger once the indicator goes from negative to positive or the other way around.
僅限邀請腳本
僅作者批准的使用者才能訪問此腳本。您需要申請並獲得使用許可,通常需在付款後才能取得。更多詳情,請依照作者以下的指示操作,或直接聯絡FieryTrading。
TradingView不建議在未完全信任作者並了解其運作方式的情況下購買或使用腳本。您也可以在我們的社群腳本中找到免費的開源替代方案。
作者的說明
Visit my website for details:
https://www.fierytrading.com/
🎯Official Channel: t.me/FieryTradingChannel
📈Try my Premium Signals for FREE - 80% Win-Rate: t.me/FT_Futures_free
✅Monster Signals: t.me/monster_cryptosignals
🔥Premium Signals: fierytrading.com
📈Try my Premium Signals for FREE - 80% Win-Rate: t.me/FT_Futures_free
✅Monster Signals: t.me/monster_cryptosignals
🔥Premium Signals: fierytrading.com
免責聲明
這些資訊和出版物並非旨在提供,也不構成TradingView提供或認可的任何形式的財務、投資、交易或其他類型的建議或推薦。請閱讀使用條款以了解更多資訊。