INVITE-ONLY SCRIPT
已更新 Momentum Indicator [LeonidasCrypto]
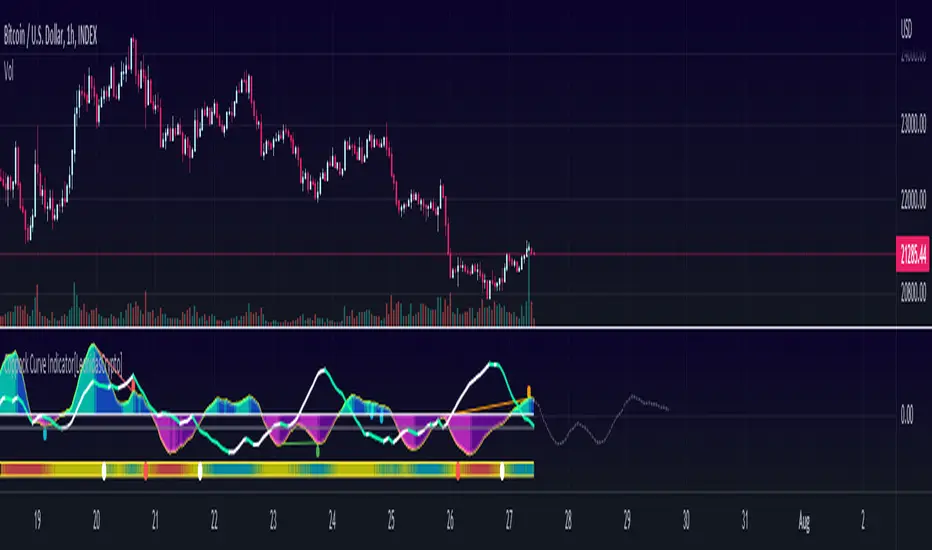
This indicator is the result of the combination of 3 indicators giving you a very powerful strategy.
Coppock Curve Indicator Summary
The Coppock Curve (CC) was introduced by economist Edwin Coppock in an October 1962 issue of Barron's
While useful, the indicator is not commonly discussed among traders and investors. Traditionally used to spot long-term trend changes in major stock indexes, traders can use the indicator for any time and in any market to isolate potential trend shifts and generate trade signals.
How to use it:
0 line is the key level Above 0 line the momentum is getting strong(bullish) below 0 line the momentum is weak(bearish)
Buy signal:
In combination with ADX, Volatility :
Wait for the curve color turning to Dark Purple(weak bearish momentum) and ADX slope in the opposite side of the trend
Sell Signal.
Wait for the curve color turning to Dark Blue (weak bull momentum) and ADX slope in the opposite side of the trend
Explosive Moves.
This indicator will help you to catch explosive moves :
Wait for the bar in the bottom of the indicator[Volatility Bar] turned blue color[Consolidation] low volatility. Enter in the next buy/sell signal following the rules I described above using this strategy you will catch in many cases very good move.
Divergences:
This indicator will help you to identify divergences
Combine the divergences generated by this indicator with the sell/bull signals to increase the probabilities for a good trade setup.
發行說明
Added info PanelNow you can see the current value of ADX
Bearish/Bullish Curve
Background panel will change the color same as the Curve(Momentum)
Added cross points in the Volatility Bar with this information you will know when volatility is expanding/contracting.
發行說明
Removed extra indicators from the chart發行說明
Removed extra indicators from the chart發行說明
Now volatility bar is an optional parameter發行說明
Updated Curved with forecast feature.How to use it:
if you enable this feature you will be able to see a potential projection of the signal.
This is a game changer feature because you will be able to anticipate potential buy/sell signals with this indicator.
僅限邀請腳本
僅作者批准的使用者才能訪問此腳本。您需要申請並獲得使用許可,通常需在付款後才能取得。更多詳情,請依照作者以下的指示操作,或直接聯絡LeonidasCrypto。
TradingView不建議在未完全信任作者並了解其運作方式的情況下購買或使用腳本。您也可以在我們的社群腳本中找到免費的開源替代方案。
作者的說明
Free trial 2 weeks .
Please send me dm to get more info
Trading for living!
免責聲明
這些資訊和出版物並非旨在提供,也不構成TradingView提供或認可的任何形式的財務、投資、交易或其他類型的建議或推薦。請閱讀使用條款以了解更多資訊。