OPEN-SOURCE SCRIPT
Variance Windows
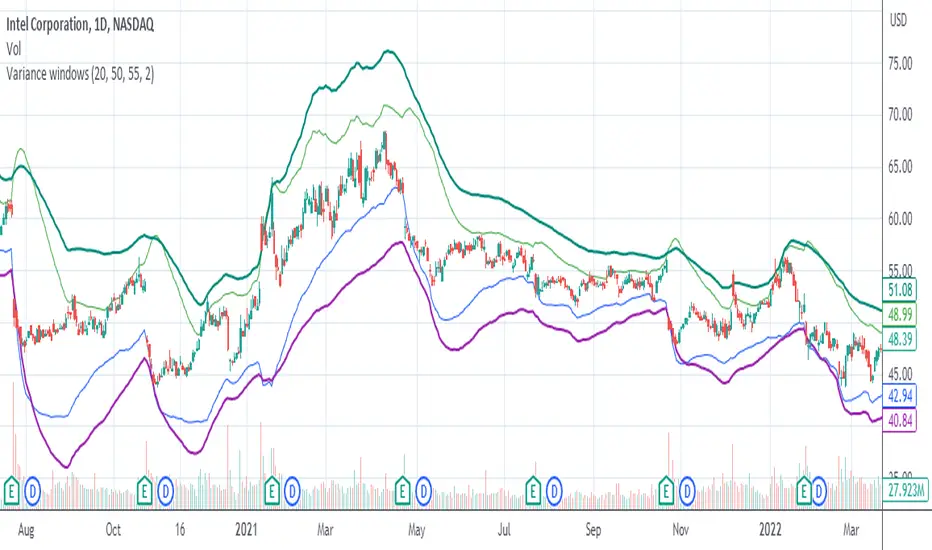
Just a quick trial at using statistical variance/standard deviation as an indicator. The general idea is that higher variance in the short term tends to indicate more volatility/movement. The other thing is that it can help set probabilistic boundaries for movements (e.g., if you set the bars to be 2 standard deviations, you are visualizing a range that denotes a 95% probability window).
I haven't really tried forming any sort of strategies around this indicator, but there are a few potential possibilities for its usability.
There's nothing too complicated or deep about this particular indicator. All I'm really doing is assuming that we are dealing with a Gaussian random process. I am actually using EMA as my mean computation, even though for a proper Gaussian variance calculation, I should be using SMA. When I used SMA, though, it felt a lot more sensitive to noise, which made it feel less usable. In any case, it's just a simple first trial in many years after not having even looked at Pine Script to finally messing around with it again. Open to a litany of criticisms as I'm sure there will be many that are rightly deserved. Otherwise, happy scalping to thee.
I haven't really tried forming any sort of strategies around this indicator, but there are a few potential possibilities for its usability.
- Generally speaking, the magnitude of the standard deviation (relative to the price) is small when the market is consolidating. It is larger when the market is trending up or own.
- If the long term variance and the short-term variance are close to each other in scale, the trend is strong. Otherwise, the trend is weak. Note that I am only saying that the "trend" is strong, not that it is necessarily positive. this could be an up-trend, down-trend, or a sideways trend.
- When the magnitudes of the variances are changing from very similar to very different (usually it's the long-term variance getting much larger than the short-term one), that's an indication that the previous trend is coming to an end.
- Typically, it's the long-term variance that is bigger than the short-term. However, when you see them cross where the short-term is bigger or even much bigger than the long-term, it's indicative of a spike event (more often than not, one that is not favorable if you are holding any position on a given security).
- Because you have probabilistic windows based on some n standard deviations from the midline (which in this version, I've used a ZLEMA as that midline), those boundaries could possibly be used to set stop-loss limits and the like.
There's nothing too complicated or deep about this particular indicator. All I'm really doing is assuming that we are dealing with a Gaussian random process. I am actually using EMA as my mean computation, even though for a proper Gaussian variance calculation, I should be using SMA. When I used SMA, though, it felt a lot more sensitive to noise, which made it feel less usable. In any case, it's just a simple first trial in many years after not having even looked at Pine Script to finally messing around with it again. Open to a litany of criticisms as I'm sure there will be many that are rightly deserved. Otherwise, happy scalping to thee.
開源腳本
秉持TradingView一貫精神,這個腳本的創作者將其設為開源,以便交易者檢視並驗證其功能。向作者致敬!您可以免費使用此腳本,但請注意,重新發佈代碼需遵守我們的社群規範。
免責聲明
這些資訊和出版物並非旨在提供,也不構成TradingView提供或認可的任何形式的財務、投資、交易或其他類型的建議或推薦。請閱讀使用條款以了解更多資訊。
免責聲明
這些資訊和出版物並非旨在提供,也不構成TradingView提供或認可的任何形式的財務、投資、交易或其他類型的建議或推薦。請閱讀使用條款以了解更多資訊。