PROTECTED SOURCE SCRIPT
Trend Ribbon
---------- INTRODUCTION ----------
Ribbon indicator is a trend indicator based on Moving Average
Default setting is 20 WMA
---------- HOW TO READ? ----------
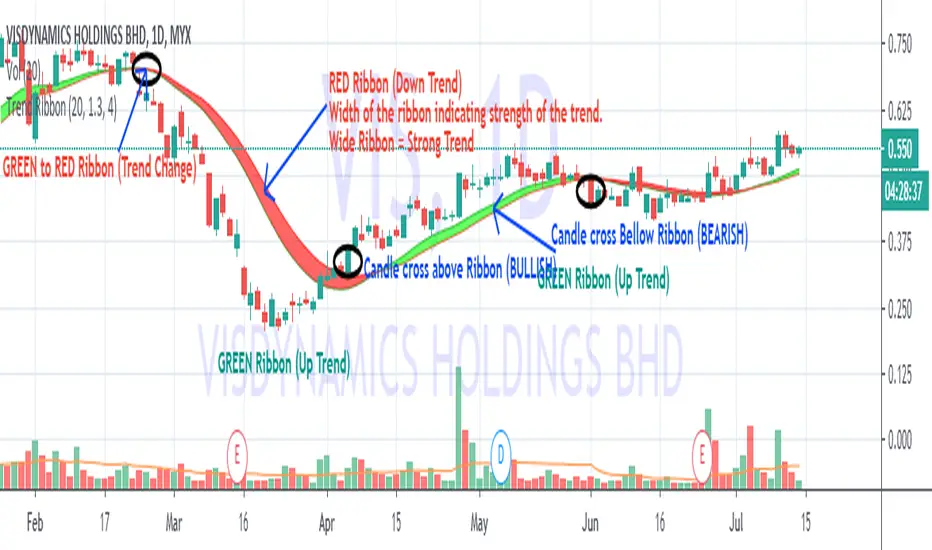
Color
GREEN RIBBON = UP TREND (Short Term EMA above Long EMA )
RED RIBBON = DOWN TREND (Short Term EMA below Long EMA )
Candle's Position
Candle above ribbon = BULLISH
Candle below ribbon = BEARISH
Width
Width of the Ribbon is indicating the strength of the trend.
Wider ribbon indicating STRONG trend.
Thin ribbon indicating WEAK trend. May indicating Ranging.
---------- HOW TO TRADE? ----------
Only BUY when BULLISH and UPTREND
Avoid trading when ranging.
NOTES:-
Use with other indicators like FiFT or MCDX to measure the strength of the BULL .
Review Global Indices to feel Global market direction to support our trading decision
Ribbon indicator is a trend indicator based on Moving Average
Default setting is 20 WMA
---------- HOW TO READ? ----------
Color
GREEN RIBBON = UP TREND (Short Term EMA above Long EMA )
RED RIBBON = DOWN TREND (Short Term EMA below Long EMA )
Candle's Position
Candle above ribbon = BULLISH
Candle below ribbon = BEARISH
Width
Width of the Ribbon is indicating the strength of the trend.
Wider ribbon indicating STRONG trend.
Thin ribbon indicating WEAK trend. May indicating Ranging.
---------- HOW TO TRADE? ----------
Only BUY when BULLISH and UPTREND
Avoid trading when ranging.
NOTES:-
Use with other indicators like FiFT or MCDX to measure the strength of the BULL .
Review Global Indices to feel Global market direction to support our trading decision
受保護腳本
此腳本以閉源形式發佈。 不過,您可以自由使用,沒有任何限制 — 點擊此處了解更多。
Contact me to learn Turtle Trading System, MCDX and other indicators (t.me/SgxFx)
tradingview.com/script/mbiUr95n-MCDX-Plus/
tradingview.com/script/mcAidXIT-FiFT-Pro/
tradingview.com/script/viAR3Ilo-Trend-Sign
tradingview.com/script/mbiUr95n-MCDX-Plus/
tradingview.com/script/mcAidXIT-FiFT-Pro/
tradingview.com/script/viAR3Ilo-Trend-Sign
免責聲明
這些資訊和出版物並非旨在提供,也不構成TradingView提供或認可的任何形式的財務、投資、交易或其他類型的建議或推薦。請閱讀使用條款以了解更多資訊。