OPEN-SOURCE SCRIPT
Wick Strategy Analyzer
Overview
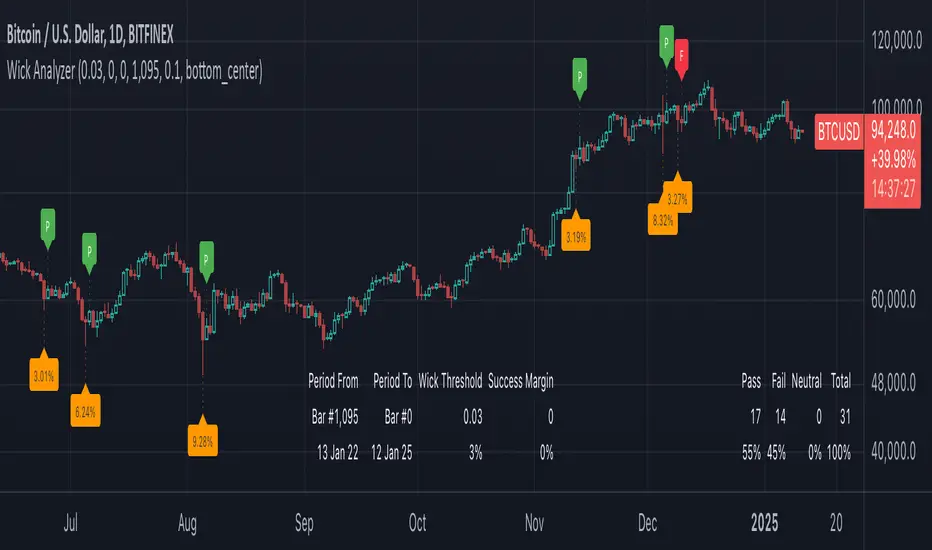
This indicator analyzes candle wick patterns and evaluates their outcomes over a user-definable range (default is 1 year). Labels are rendered on the chart to mark events that meet the specified wick condition.
Features
Customizable Bar Range - users can specify the range of bars to include in the analysis. Default is 365 bars back from the most recent bar (bar 0)
Visual Indicators - labels are rendered to mark conditions & outcomes.
Input Parameters
Example Scenario
Goal: Analyze how candles with a wick size of at least 3.5% perform within a success margin of 1% over the past 540 days.
Setup:
Expected Output
This indicator analyzes candle wick patterns and evaluates their outcomes over a user-definable range (default is 1 year). Labels are rendered on the chart to mark events that meet the specified wick condition.
Features
Customizable Bar Range - users can specify the range of bars to include in the analysis. Default is 365 bars back from the most recent bar (bar 0)
Visual Indicators - labels are rendered to mark conditions & outcomes.
- Wick Condition Met - an Orange label below the wick candle displaying the wick’s percentage size.
- Outcome Labels - rendered above the candle after wick condition met candles
- P (Green): Pass
- F (Red): Fail
- N (Navy): Neutral
- I (Blue): Indicates the current candle has not yet closed, so the outcome is undetermined.
- P (Green): Pass
Input Parameters
- Wick Threshold [default 0.05 (5%), range 0.0 to 1.0] - minimum wick size required to qualify as a wick condition.
- Success Margin [default 0.0, range 0.0 to 1.0)] - Defines the margin for classifying outcomes as Pass, Fail, or Neutral. E.g., a success margin of 0.01 requires the next candle's close to exceed the wick candle's close by 1% in order to be a Pass.
- Bar Offset Start [default 0] - starting offset from the last bar for analysis. A value of -1 will include all bars.
- Bar Offset End [default 365] - ending offset from the last bar for analysis. Bars outside this range are excluded.
Example Scenario
Goal: Analyze how candles with a wick size of at least 3.5% perform within a success margin of 1% over the past 540 days.
Setup:
- Set Wick Threshold to 0.035
- Set Success Margin to 0.01
- Set Bar Range Start to 0
- Set Bar Range End to 540.
Expected Output
- Candles with a wick of at least 3.5% are labeled.
- Outcome labels (P, F, or N) indicate performance.
開源腳本
秉持TradingView一貫精神,這個腳本的創作者將其設為開源,以便交易者檢視並驗證其功能。向作者致敬!您可以免費使用此腳本,但請注意,重新發佈代碼需遵守我們的社群規範。
免責聲明
這些資訊和出版物並非旨在提供,也不構成TradingView提供或認可的任何形式的財務、投資、交易或其他類型的建議或推薦。請閱讀使用條款以了解更多資訊。
免責聲明
這些資訊和出版物並非旨在提供,也不構成TradingView提供或認可的任何形式的財務、投資、交易或其他類型的建議或推薦。請閱讀使用條款以了解更多資訊。