PROTECTED SOURCE SCRIPT
已更新 Pivot Points Standard M, W, D (Monthly, Weekly & Daily)
This script is based on Pivot Point Standard and is intended for educational purposes only.
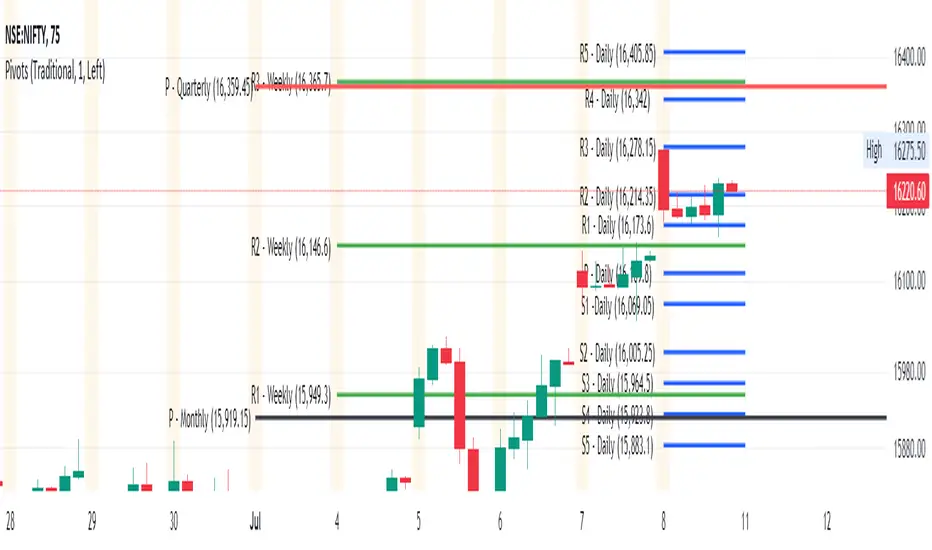
"Pivot points are a technical indicator that is used to determine the levels at which price may face support or resistance.
Pivot Points indicator consists of a Pivot (P) level, several support (S) and several resistance (R)."
You can view the Daily timeframe - support/resistance.
You can view the Weekly timeframe - support/resistance.
You can view the Monthly timeframe - support/resistance.
Options to choose "Traditional" or "Fibonacci" or "Woodie" or "Classic" or "DM" or "Camarilla"
Options to choose historical pivots (Number of Pivots Back)
This tool can be handy in any trading process from short-long term trades or timeframes, multiple timeframe analysis, trend trades, swing trades, position trades, and momentum trades.
Credits
Credits to TradingView for original built-in source code
發行說明
July 2022 Update Option to Change the Colour for Daily / Weekly / Monthly Pivots
Option to Show Prices
發行說明
Pivots Quarterly and Pivots Yearly Timeframe addedOption to Choose the Timeframe Daily / Weekly / Monthly / Quarterly / Yearly Pivots
Option to Change the Color for Daily / Weekly / Monthly / Quarterly / Yearly Pivots
受保護腳本
此腳本以閉源形式發佈。 不過,您可以自由使用,沒有任何限制 — 點擊此處了解更多。
免責聲明
這些資訊和出版物並非旨在提供,也不構成TradingView提供或認可的任何形式的財務、投資、交易或其他類型的建議或推薦。請閱讀使用條款以了解更多資訊。
受保護腳本
此腳本以閉源形式發佈。 不過,您可以自由使用,沒有任何限制 — 點擊此處了解更多。
免責聲明
這些資訊和出版物並非旨在提供,也不構成TradingView提供或認可的任何形式的財務、投資、交易或其他類型的建議或推薦。請閱讀使用條款以了解更多資訊。