OPEN-SOURCE SCRIPT
Heiken Ashi with RSI Colors
📜 Description:
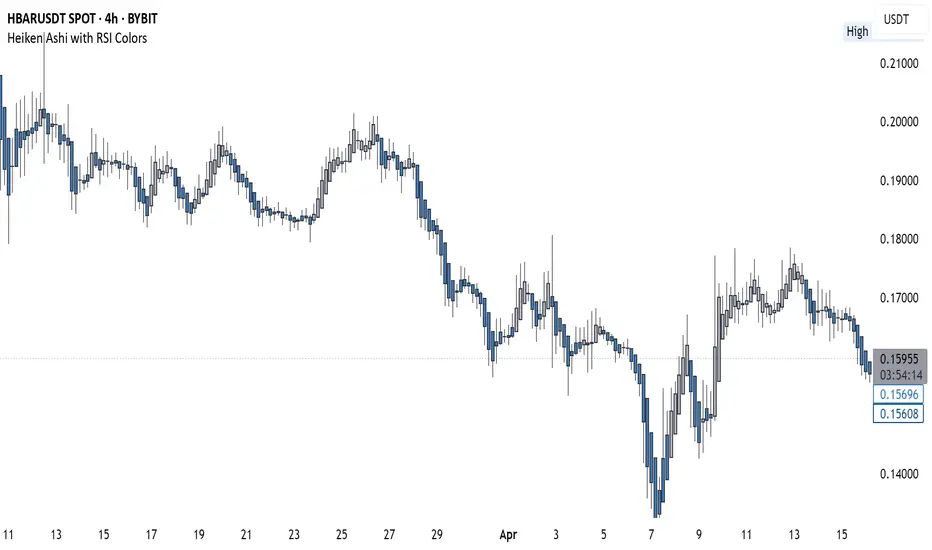
This indicator blends Heiken Ashi candlesticks with RSI-based color filters to help traders quickly assess both trend structure and momentum extremes in a single glance.
✅ Heiken Ashi Mode: Smooths out price action to highlight clearer trends and suppress noise
✅ RSI Coloring: Applies candle color changes based on whether RSI is overbought, oversold, or neutral
It allows traders to visually spot potential exhaustion zones, continuation trends, or early reversal areas with enhanced clarity.
🔧 Settings:
Use Heiken Ashi Candles: Toggle between standard candles and Heiken Ashi smoothed values
RSI Length: Controls the lookback for RSI calculation (default 14)
Overbought/Oversold Levels: Customize your thresholds for extreme conditions (default: 70/30)
🎨 Candle Color Logic:
Green (Lime): RSI is overbought → price may be overextended upward
Red: RSI is oversold → price may be overextended downward
Gray: RSI is between extremes → neutral momentum
💡 Use Cases:
Confirm trend momentum with Heiken Ashi structure
Spot potential reversal points using RSI extremes
Enhance entry/exit decisions by combining price action and momentum in a single visual
開源腳本
秉持TradingView一貫精神,這個腳本的創作者將其設為開源,以便交易者檢視並驗證其功能。向作者致敬!您可以免費使用此腳本,但請注意,重新發佈代碼需遵守我們的社群規範。
免責聲明
這些資訊和出版物並非旨在提供,也不構成TradingView提供或認可的任何形式的財務、投資、交易或其他類型的建議或推薦。請閱讀使用條款以了解更多資訊。
開源腳本
秉持TradingView一貫精神,這個腳本的創作者將其設為開源,以便交易者檢視並驗證其功能。向作者致敬!您可以免費使用此腳本,但請注意,重新發佈代碼需遵守我們的社群規範。
免責聲明
這些資訊和出版物並非旨在提供,也不構成TradingView提供或認可的任何形式的財務、投資、交易或其他類型的建議或推薦。請閱讀使用條款以了解更多資訊。