OPEN-SOURCE SCRIPT
Bolingger Bands + Inside Bar Boxes
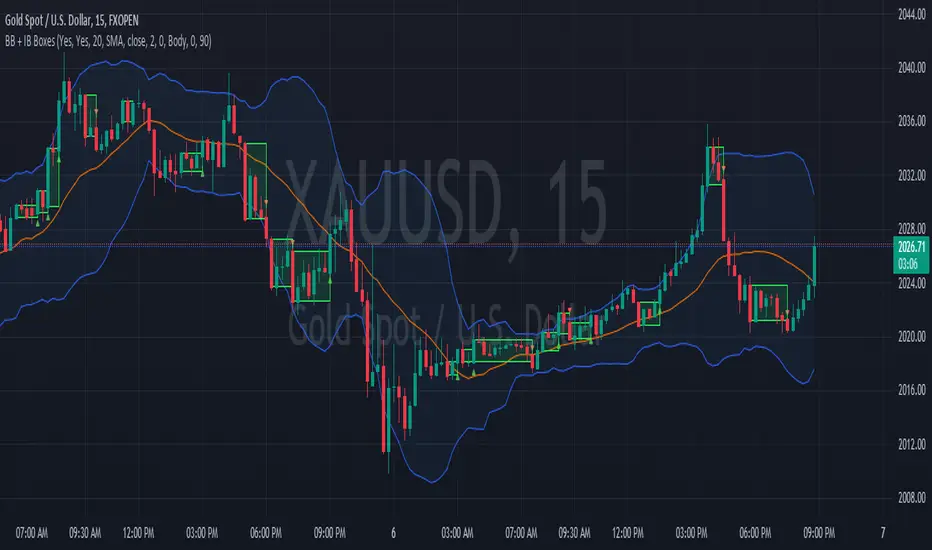
Bollinger Bands are a technical analysis tool consist of three bands—an upper, middle, and lower band—that are used to spotlight extreme short-term prices in a security. The upper band represents overbought territory, while the lower band can show you when a security is oversold. Most technicians will use Bollinger Bands® in conjunction with other analysis tools to get a better picture of the current state of a market or security.
An Inside Bar is a two-bar price action trading strategy in which the inside bar is smaller and within the high to low range of the prior bar. Inside bars show a period of consolidation in a market. They often form following a strong move in a market, as it ‘pauses’ to consolidate before making its next move. However, they can also form at market turning points and act as reversal signals from key support or resistance levels.
An Inside Bar is a two-bar price action trading strategy in which the inside bar is smaller and within the high to low range of the prior bar. Inside bars show a period of consolidation in a market. They often form following a strong move in a market, as it ‘pauses’ to consolidate before making its next move. However, they can also form at market turning points and act as reversal signals from key support or resistance levels.
開源腳本
秉持TradingView一貫精神,這個腳本的創作者將其設為開源,以便交易者檢視並驗證其功能。向作者致敬!您可以免費使用此腳本,但請注意,重新發佈代碼需遵守我們的社群規範。
免責聲明
這些資訊和出版物並非旨在提供,也不構成TradingView提供或認可的任何形式的財務、投資、交易或其他類型的建議或推薦。請閱讀使用條款以了解更多資訊。
免責聲明
這些資訊和出版物並非旨在提供,也不構成TradingView提供或認可的任何形式的財務、投資、交易或其他類型的建議或推薦。請閱讀使用條款以了解更多資訊。