OPEN-SOURCE SCRIPT
已更新 Colored Moving Averages With Close Signals[Whvntr][TradeStation]
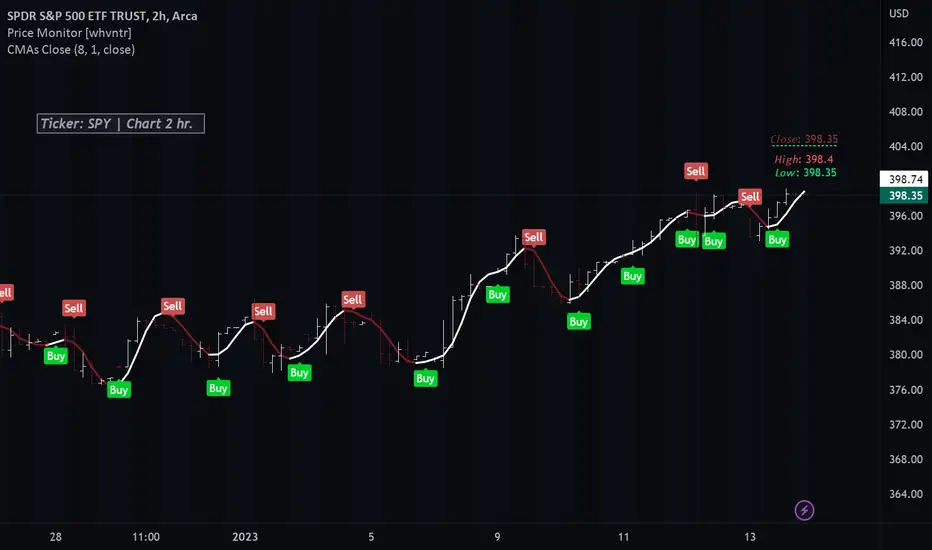
Plots the first time the close price is above or below the colored portion of the chosen MA. The MA's formula is from TradeStation's indicator: "Colored Moving Averages Can Help You Spot Trends". I modified that indicator with customizations that include: Buy and Sell signals. Each time the current bar closes above the MA, while it's red (bearish), there's a Sell label at the start of that MA trend. Likewise: each time the current bar closes below the MA, while it's white (bullish), there's a Buy label at the beginning of that MA trend. You can now, also, easily see which MA you are selecting by hovering your cursor over the tooltips icon. I've included a modified Hull MA as default because I've found this SMA combination with the WMA to be a very smooth oscillation. I've also added some different types of MA's. Colored moving averages are helpful to determine when a trend may be reversing.
MA's
1 · Modified Hull MA: (SMA of the WMAs Hull Formula)
2 · Hull MA
3 · Exponential Moving Average
4 · Weighted Moving Average
5 · RMA Moving Average used in RSI
6 · Volume Weighted MA
7 · Simple Moving Average
This indicator isn't endorsed as a guarantee of future, favorable, results.
MA's
1 · Modified Hull MA: (SMA of the WMAs Hull Formula)
2 · Hull MA
3 · Exponential Moving Average
4 · Weighted Moving Average
5 · RMA Moving Average used in RSI
6 · Volume Weighted MA
7 · Simple Moving Average
This indicator isn't endorsed as a guarantee of future, favorable, results.
發行說明
Sidenote: Nor is this indicator endorsed by TradeStation (I modified their indicator)發行說明
Plot is editable in Style發行說明
Added an MA Tooltip. Updated the default MA length to 5 from 8.發行說明
Alternate settings idea: MA #5(RMA), length 7https://www.tradingview.com/x/92vY79tj/
開源腳本
秉持TradingView一貫精神,這個腳本的創作者將其設為開源,以便交易者檢視並驗證其功能。向作者致敬!您可以免費使用此腳本,但請注意,重新發佈代碼需遵守我們的社群規範。
免責聲明
這些資訊和出版物並非旨在提供,也不構成TradingView提供或認可的任何形式的財務、投資、交易或其他類型的建議或推薦。請閱讀使用條款以了解更多資訊。
免責聲明
這些資訊和出版物並非旨在提供,也不構成TradingView提供或認可的任何形式的財務、投資、交易或其他類型的建議或推薦。請閱讀使用條款以了解更多資訊。