OPEN-SOURCE SCRIPT
The Next Pivot (With History) [Mxwll]

Introducing "The Next Pivot (With History)"!
With permission from the author KioseffTrading
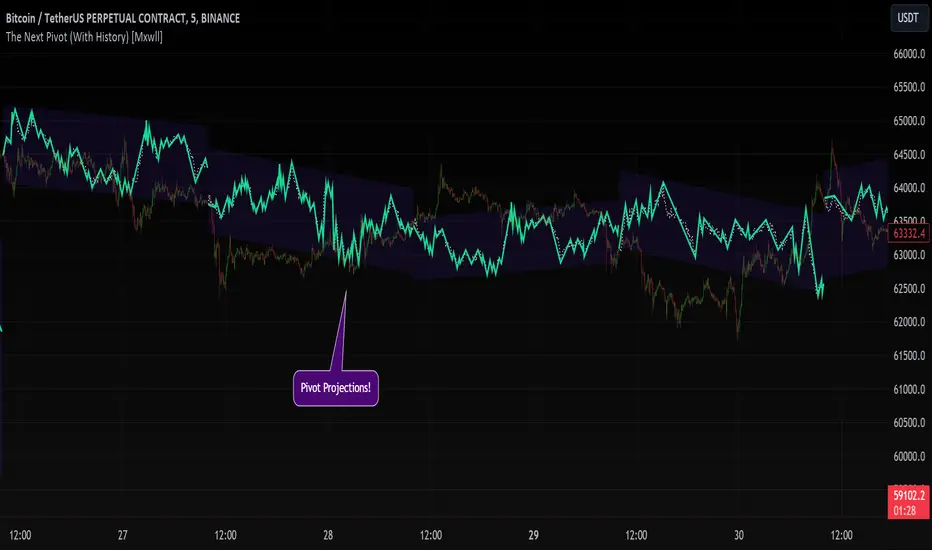
The script "The Next Pivot" has been restructured to show historical projections!
Features

The image above shows/explains some of the indicator's capabilities!
Additionally, you can project almost any indicator!

Should load times permit it, the script can search all bar history for a correlating sequence. This won't always be possible, contingent on the forecast length, correlation length, and the number of bars on the chart.

If a load time error occurs, simple reduce the "Bars Back To Search" parameter!
The script can only draw 500 bars into the future. For whatever time frame you are on and the session you wish to project, ensure it will not exceeded a 500-bar forecast!
Reasonable Assessment
The script uses various similarity measures to find the "most similar" price sequence to what's currently happening. Once found, the subsequent price move (to the most similar sequence) is recorded and projected forward.
So,
1: Script finds most similar price sequence
2: Script takes what happened after and projects forward
While this may be useful, the projection is simply the reaction to a possible one-off "similarity" to what's currently happening. Random fluctuations are likely and, if occurring, similarities between the current price sequence and the "most similar" sequence are plausibly coincidental.
Thanks!
With permission from the author KioseffTrading
The script "The Next Pivot" has been restructured to show historical projections!
Features
- Find the most similar price sequence per time frame change.
- Forecast almost any public indicator! Not just price!
- Forecast any session i.e. 4Hr, 1Hr, 15m, 1D, 1W
- Forecast ZigZag for any session
- Spearmen
- Pearson
- Absolute Difference
- Cosine Similarity
- Mean Squared Error
- Kendall
- Forecasted linear regression channel
The image above shows/explains some of the indicator's capabilities!
Additionally, you can project almost any indicator!
Should load times permit it, the script can search all bar history for a correlating sequence. This won't always be possible, contingent on the forecast length, correlation length, and the number of bars on the chart.
If a load time error occurs, simple reduce the "Bars Back To Search" parameter!
The script can only draw 500 bars into the future. For whatever time frame you are on and the session you wish to project, ensure it will not exceeded a 500-bar forecast!
Reasonable Assessment
The script uses various similarity measures to find the "most similar" price sequence to what's currently happening. Once found, the subsequent price move (to the most similar sequence) is recorded and projected forward.
So,
1: Script finds most similar price sequence
2: Script takes what happened after and projects forward
While this may be useful, the projection is simply the reaction to a possible one-off "similarity" to what's currently happening. Random fluctuations are likely and, if occurring, similarities between the current price sequence and the "most similar" sequence are plausibly coincidental.
Thanks!
開源腳本
秉持TradingView一貫精神,這個腳本的創作者將其設為開源,以便交易者檢視並驗證其功能。向作者致敬!您可以免費使用此腳本,但請注意,重新發佈代碼需遵守我們的社群規範。
免責聲明
這些資訊和出版物並非旨在提供,也不構成TradingView提供或認可的任何形式的財務、投資、交易或其他類型的建議或推薦。請閱讀使用條款以了解更多資訊。
開源腳本
秉持TradingView一貫精神,這個腳本的創作者將其設為開源,以便交易者檢視並驗證其功能。向作者致敬!您可以免費使用此腳本,但請注意,重新發佈代碼需遵守我們的社群規範。
免責聲明
這些資訊和出版物並非旨在提供,也不構成TradingView提供或認可的任何形式的財務、投資、交易或其他類型的建議或推薦。請閱讀使用條款以了解更多資訊。