PROTECTED SOURCE SCRIPT
Liquidation Bands (+CVD Bubbles) - By Leviathan
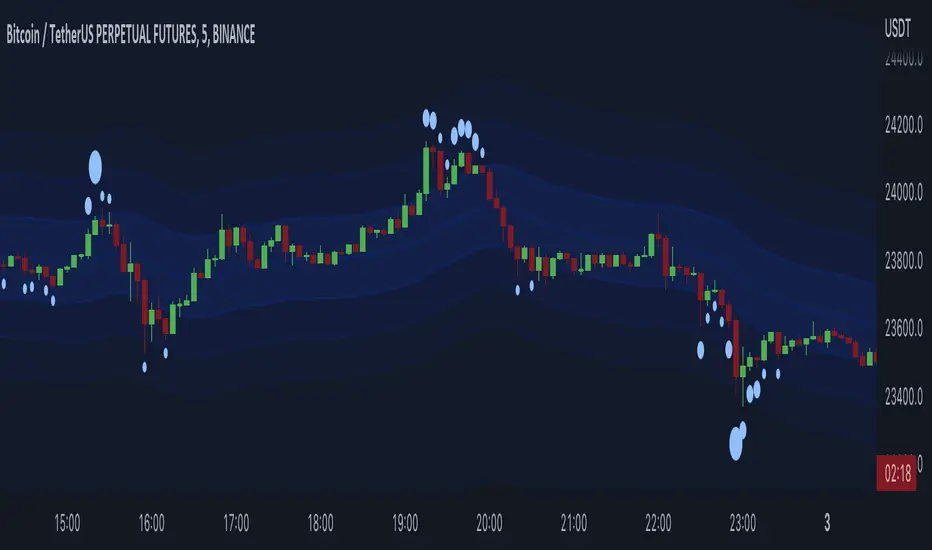
Along with CVD bubbles, this script plots continuous bands that represent 100x, 75x, 50x, 25x liquidation levels. The bands can serve as support/resistance, reversal points, expected volatility range and more.
The indicator uses either the Exponential Moving Average (EMA) or the Volume Weighted Average Price (VWAP) as a base for plotting continuous lines and zones set at the approximate distance of 100x, 75x, 50x, 25x leverage liquidation prices.
These bands can help you visualize:
- Dynamic Support and Resistance levels
- Levels that the price will gravitate towards
- Expected price range (potential volatility)
- Reversal points
- ...
The "CVD Bubbles" part of this script plots circles that are based on my imitation of Cumulative Volume Delta (CVD).
CVD Bubbles will appear when buy/sell volume is increased. The larger the bubble, the more buying/selling at that candle.
"Buy Order" CVD Bubbles appear above candles and might signal:
- Late longers entering the market
- Large short liquidations (closed short=buy order)
- Large market buys getting absorbed by limit sell orders
=> Bias: potential reversal to the downside
"Sell Order" CVD Bubbles appear below candles and might signal:
- Late shorters entering the market
- Large long liquidations (closed long=sell order)
- Large market sells getting absorbed by limit buy orders
=> Bias: potential reversal to the upside
Combining Liquidation Bands and CVD Bubbles can serve you as confluence for taking a trade, but don't follow them blindly.
Settings:
"Mode" - Choose the base for Liquidation Bands (EMA or VWAP)
"EMA/CVD Length" - Choose the length (number of bars) for calculating EMA and CVD
"Level Calculation Mode" - Choose between 3 variations of calculating the distance to Liquidation Bands
"Standard Deviation Length" - Choose the length used for calculating the thresholds of CVD
"Appearance" - Choose the colors of lines, zones and CVD Bubbles
"STDEV MULT." - Multiply the thresholds used for CVD Bubble Sizes
受保護腳本
此腳本以閉源形式發佈。 不過,您可以自由且不受任何限制地使用它 — 在此處了解更多資訊。
免責聲明
這些資訊和出版物並不意味著也不構成TradingView提供或認可的金融、投資、交易或其他類型的意見或建議。請在使用條款閱讀更多資訊。
受保護腳本
此腳本以閉源形式發佈。 不過,您可以自由且不受任何限制地使用它 — 在此處了解更多資訊。
免責聲明
這些資訊和出版物並不意味著也不構成TradingView提供或認可的金融、投資、交易或其他類型的意見或建議。請在使用條款閱讀更多資訊。