PROTECTED SOURCE SCRIPT
已更新 Mioone´s TEMA100vsEMA800(Feat. ACEACEACE)
Mioone´s TEMA100vsEMA800(Feat. ACEACEACE)
Inspired by CryptoAman better know as ACEACEACE
TEMA1000 vs EMA800
What does it do?
Shows the TEMA1000 in relation to EMA800.
Shows the Coin in relation to EMA800
If you look at the value of the coins, you will notice that the coin magically moves closer to the EMA800.
That's why I created the indicator with the relation of the Coin to the EMA800 as a addon, so you can see how many bucks the Coin can go up or down when it is looking for the proximity to the EMA800.
Basically:
If the TEMA1000 goes below EMA800 the signal is rather bearish.
If the TEMA1000 breaks up through the EMA800 on larger time frames, this can often produce a DIP or start a run up.
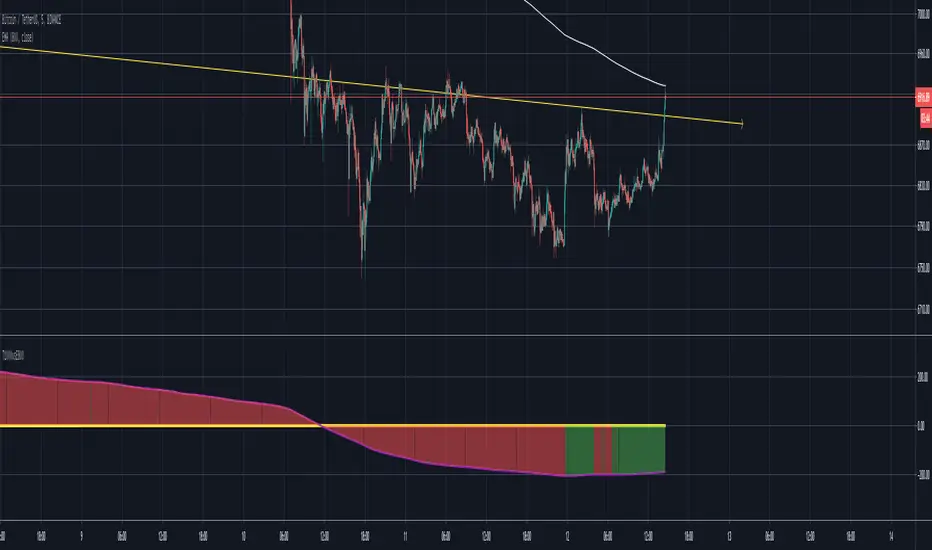
Yelloline = Null Line
Greenline = Coinvalue smoothed with EMA1 in relation to EMA800 (Means if EMA800 = 10.000$ and CoinValue = 10.200$ the Greenline shows the Difference +200 $ over EMA800
Purpleline = TEMA1000 in Relation to EMA800 (TEMA1000 over EMA800 = Bullish , Under EMA800 = Bearish)
Colorfilling
Filling Green if Coinvalue (EMA9) > EMA800 = Bullish
Filling Red if Coinvalue (ema9) < EMA800 = Bearish)
Purple Crossover Yello = Bullcross
Purple Crossunder Yello = Bearcross
Take care of your Trades....
Mioone
Inspired by CryptoAman better know as ACEACEACE
TEMA1000 vs EMA800
What does it do?
Shows the TEMA1000 in relation to EMA800.
Shows the Coin in relation to EMA800
If you look at the value of the coins, you will notice that the coin magically moves closer to the EMA800.
That's why I created the indicator with the relation of the Coin to the EMA800 as a addon, so you can see how many bucks the Coin can go up or down when it is looking for the proximity to the EMA800.
Basically:
If the TEMA1000 goes below EMA800 the signal is rather bearish.
If the TEMA1000 breaks up through the EMA800 on larger time frames, this can often produce a DIP or start a run up.
Yelloline = Null Line
Greenline = Coinvalue smoothed with EMA1 in relation to EMA800 (Means if EMA800 = 10.000$ and CoinValue = 10.200$ the Greenline shows the Difference +200 $ over EMA800
Purpleline = TEMA1000 in Relation to EMA800 (TEMA1000 over EMA800 = Bullish , Under EMA800 = Bearish)
Colorfilling
Filling Green if Coinvalue (EMA9) > EMA800 = Bullish
Filling Red if Coinvalue (ema9) < EMA800 = Bearish)
Purple Crossover Yello = Bullcross
Purple Crossunder Yello = Bearcross
Take care of your Trades....
Mioone
發行說明
The histogram decreases from the value -> This is generally a bearish signalThe histogram increases in value -> This is generally a bullish signal
Principle rules:
Place a long into a bullish signal (Green Lines)
Place a short into a bearish signal (Red Lines)
Going against the trend is a high risk.
Small Update:
It is now displayed when a trend has changed from the last value (green and red lines). Thus a trend reversal can be seen better.
Translated with DeepL.com/Translator (free version)
受保護腳本
此腳本以閉源形式發佈。 不過,您可以自由使用,沒有任何限制 — 點擊此處了解更多。
免責聲明
這些資訊和出版物並非旨在提供,也不構成TradingView提供或認可的任何形式的財務、投資、交易或其他類型的建議或推薦。請閱讀使用條款以了解更多資訊。
免責聲明
這些資訊和出版物並非旨在提供,也不構成TradingView提供或認可的任何形式的財務、投資、交易或其他類型的建議或推薦。請閱讀使用條款以了解更多資訊。