INVITE-ONLY SCRIPT
Trend vs Mean Reversion Indicator (ADF Test) {DCAquant}
ADF Trend/Mean Reversion Analysis Indicator {DCAquant}
The ADF Trend/Mean Reversion Analysis Indicator, is a groundbreaking tool engineered to discern the underlying structure of financial markets. It employs the esteemed Augmented Dickey-Fuller (ADF) test to analyze time series data, providing traders with a robust statistical basis to distinguish between trending and mean-reverting market environments.
Comprehensive Market Analysis:
Advanced Statistical Foundation: Leverages the ADF test to statistically evaluate the likelihood of a trend sustaining or a reversion to the mean, making it a critical component of a quantitative trader’s toolkit.
Market Condition Visualization: The indicator’s color-coded system serves as a visual guide to the current market state, helping traders identify shifts in market dynamics with ease.
Configurable Sensitivity: Customizable parameters allow for fine-tuning the indicator's responsiveness, ensuring adaptability across various assets and market conditions.
Enhanced Indicator Features:
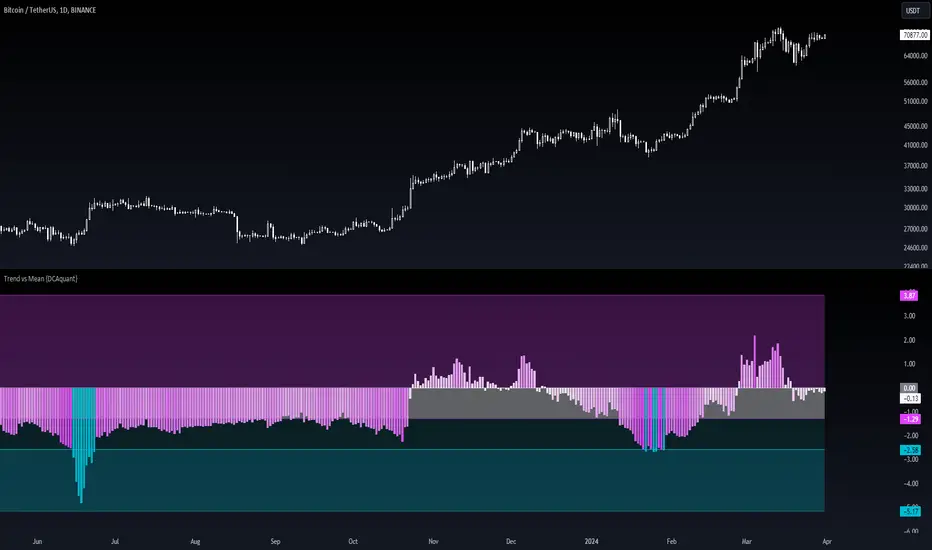
Aqua and Teal Bars: Depict a market that is statistically more inclined toward mean reversion, potentially signaling retracements or reversals, hence providing strategic points for counter-trend entries.
Fuchsia and Purple Bars: Identify a trending market regime where the persistence of price direction is statistically significant, thus supporting strategies that follow the trend.
Adaptive to Market Caps and Assets: Whether applied to broad market indices or individual securities, this indicator dynamically adjusts, making it an invaluable asset for diverse trading portfolios.
Strategic Trading Implications:
Dual-Strategy Adaptation: The indicator's nuanced presentation allows traders to switch between trend-following and counter-trend strategies, providing a flexible approach to both long-term investors and short-term traders.
Robust Signal Confirmation: It enhances trade confirmation when used alongside other technical indicators such as moving averages, momentum oscillators, or volume-based measures, offering a multi-layered analysis.
Informed Decision Making: By understanding the statistical tendencies of market behavior, traders can make more informed decisions that align with their individual risk profiles and trading objectives.
Customization and Optimization:
Selectable Confidence Levels: Choose from 90%, 95%, or 99% confidence levels to match the statistical rigor with your risk appetite.
Flexible Source and Lookback Periods: Adjust the price source and historical window to optimize the ADF test's application to different trading styles and timeframes, from intra-day to long-term analysis.
In-depth Indicator Usage:
Mean Reversion Opportunities: Utilize the indicator's mean-reverting signals to identify potential tops or bottoms, and adjust your position sizes and stop-loss placements accordingly.
Trend Continuation: In trending phases, use the indicator’s readings to reinforce your conviction in holding positions, managing trades with the confidence of statistical backing.
Disclaimer and Best Practices:
The ADF Trend/Mean Reversion Analysis Indicator {DCAquant} represents a fusion of statistical theory and technical analysis, designed to augment the trader's insight. It is intended to be used as a component of a holistic trading strategy. While it offers a sophisticated analysis, all traders are advised to apply rigorous risk management and not to rely solely on one indicator for trading signals.
The ADF Trend/Mean Reversion Analysis Indicator, is a groundbreaking tool engineered to discern the underlying structure of financial markets. It employs the esteemed Augmented Dickey-Fuller (ADF) test to analyze time series data, providing traders with a robust statistical basis to distinguish between trending and mean-reverting market environments.
Comprehensive Market Analysis:
Advanced Statistical Foundation: Leverages the ADF test to statistically evaluate the likelihood of a trend sustaining or a reversion to the mean, making it a critical component of a quantitative trader’s toolkit.
Market Condition Visualization: The indicator’s color-coded system serves as a visual guide to the current market state, helping traders identify shifts in market dynamics with ease.
Configurable Sensitivity: Customizable parameters allow for fine-tuning the indicator's responsiveness, ensuring adaptability across various assets and market conditions.
Enhanced Indicator Features:
Aqua and Teal Bars: Depict a market that is statistically more inclined toward mean reversion, potentially signaling retracements or reversals, hence providing strategic points for counter-trend entries.
Fuchsia and Purple Bars: Identify a trending market regime where the persistence of price direction is statistically significant, thus supporting strategies that follow the trend.
Adaptive to Market Caps and Assets: Whether applied to broad market indices or individual securities, this indicator dynamically adjusts, making it an invaluable asset for diverse trading portfolios.
Strategic Trading Implications:
Dual-Strategy Adaptation: The indicator's nuanced presentation allows traders to switch between trend-following and counter-trend strategies, providing a flexible approach to both long-term investors and short-term traders.
Robust Signal Confirmation: It enhances trade confirmation when used alongside other technical indicators such as moving averages, momentum oscillators, or volume-based measures, offering a multi-layered analysis.
Informed Decision Making: By understanding the statistical tendencies of market behavior, traders can make more informed decisions that align with their individual risk profiles and trading objectives.
Customization and Optimization:
Selectable Confidence Levels: Choose from 90%, 95%, or 99% confidence levels to match the statistical rigor with your risk appetite.
Flexible Source and Lookback Periods: Adjust the price source and historical window to optimize the ADF test's application to different trading styles and timeframes, from intra-day to long-term analysis.
In-depth Indicator Usage:
Mean Reversion Opportunities: Utilize the indicator's mean-reverting signals to identify potential tops or bottoms, and adjust your position sizes and stop-loss placements accordingly.
Trend Continuation: In trending phases, use the indicator’s readings to reinforce your conviction in holding positions, managing trades with the confidence of statistical backing.
Disclaimer and Best Practices:
The ADF Trend/Mean Reversion Analysis Indicator {DCAquant} represents a fusion of statistical theory and technical analysis, designed to augment the trader's insight. It is intended to be used as a component of a holistic trading strategy. While it offers a sophisticated analysis, all traders are advised to apply rigorous risk management and not to rely solely on one indicator for trading signals.
僅限邀請腳本
僅作者批准的使用者才能訪問此腳本。您需要申請並獲得使用許可,通常需在付款後才能取得。更多詳情,請依照作者以下的指示操作,或直接聯絡DCAquant。
請注意,此私人、僅限受邀使用者使用的腳本未經腳本審核員審核,其是否符合社群規範尚待確定。 TradingView不建議在未完全信任作者並了解其運作方式的情況下購買或使用腳本。您也可以在我們的社群腳本中找到免費的開源替代方案。
作者的說明
Please visit dcaquant.com or contact us via info@dcaquant.com or directly on TradingView.
免責聲明
這些資訊和出版物並非旨在提供,也不構成TradingView提供或認可的任何形式的財務、投資、交易或其他類型的建議或推薦。請閱讀使用條款以了解更多資訊。